4 minute read · Ultimo Research Desk · Reviewed 5 Sept 2026
What is Indices Trading? S&P 500 and NASDAQ CFDs
Buying every share in the S&P 500 would take a fortune and five hundred orders. Trading the index takes one click. That is the appeal of indices trading: a single instrument that captures the movement of an entire stock market — its trends, its news reactions, its sessions — without picking individual companies.
What an Index Actually Is
A stock index is a weighted average of a basket of shares. The S&P 500 tracks the 500 largest US companies; the NASDAQ 100 concentrates the biggest non-financial (mostly technology) names; the Dow Jones covers 30 blue chips; Europe's DAX 40 (Germany) and FTSE 100 (UK) and Asia's Nikkei 225 (Japan) do the same for their markets. You can't buy an index itself — it's a number — so traders use derivatives that track it, most commonly index CFDs.
Why Traders Choose Indices
Built-in diversification. One bad earnings report can crush a single stock 20% overnight; in a 500-company basket it barely registers. Index moves are driven by the macro picture, not one CEO's quarter.
Clean trends and deep liquidity. Major indices are among the most liquid instruments in the world, with tight spreads and technical behaviour that suits chart-based trading.
Two-way access with leverage. CFDs let you go short as easily as long — in a falling market an index short is often the simplest expression of a bearish view — and control a large notional with a modest margin. As always, leverage cuts both ways; size positions by the rules in our risk management guide.
What Moves Index Prices
Central bank policy dominates. Interest-rate expectations move equity valuations directly — a dovish Fed surprise can lift the NASDAQ in minutes.
Economic data: US CPI, jobs reports (NFP) and PMIs set the macro tone. Indices react to these releases as sharply as currency pairs do.
Earnings season matters most for concentrated indices — a handful of mega-cap tech results can move the NASDAQ 100 by itself.
Risk sentiment ties it together: indices are the market's mood ring, rising with confidence and falling when capital runs to safety (often into gold).
When to Trade Which Index
Each index is most active in its home session — DAX and FTSE in the London morning, US indices from the New York open (14:30 GMT), Nikkei in Asian hours. The US cash open and the first hour after it are typically the day's most volatile window for S&P 500 and NASDAQ. Our session guide applies here too.
Common Approaches
Trend following on daily charts suits indices' long directional phases. Breakout trading around the cash open captures the morning range expansion. News trading on CPI/Fed days offers volatility with defined event timing. Whatever the method: stop on every trade, and respect that index gaps over weekends and holidays can jump a stop — position sizing is the defence.
Cash Index or Futures? The Difference That Costs Money
Most brokers quote two instruments on the same index and traders often pick one without knowing why. The choice changes what you pay.
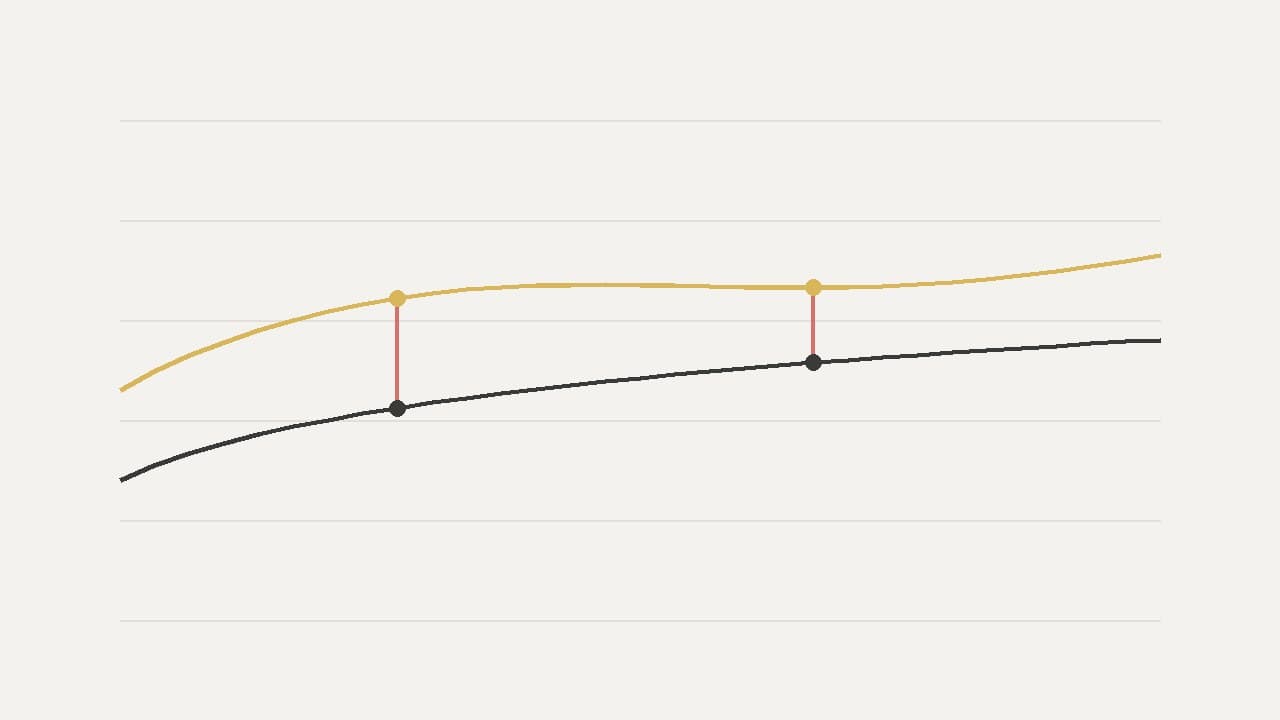
Cash indices (sometimes "spot") track the index level continuously and never expire. Spreads are tighter, which suits short-term trading — but every night you hold a long position you pay overnight financing. Hold one for three months and the financing quietly becomes the largest line in your P&L.
Index futures have an expiry date and a wider spread, and carry no nightly financing — the cost is already built into the futures price. For a position you intend to hold for weeks, that is usually the cheaper structure. The catch is the expiry: you must close or roll before it, and rolling means paying the spread again.
The practical rule: days, use cash; weeks or months, look at the future. If you are unsure how long you will hold, that itself is worth resolving before you open.
What an Index Trade Costs
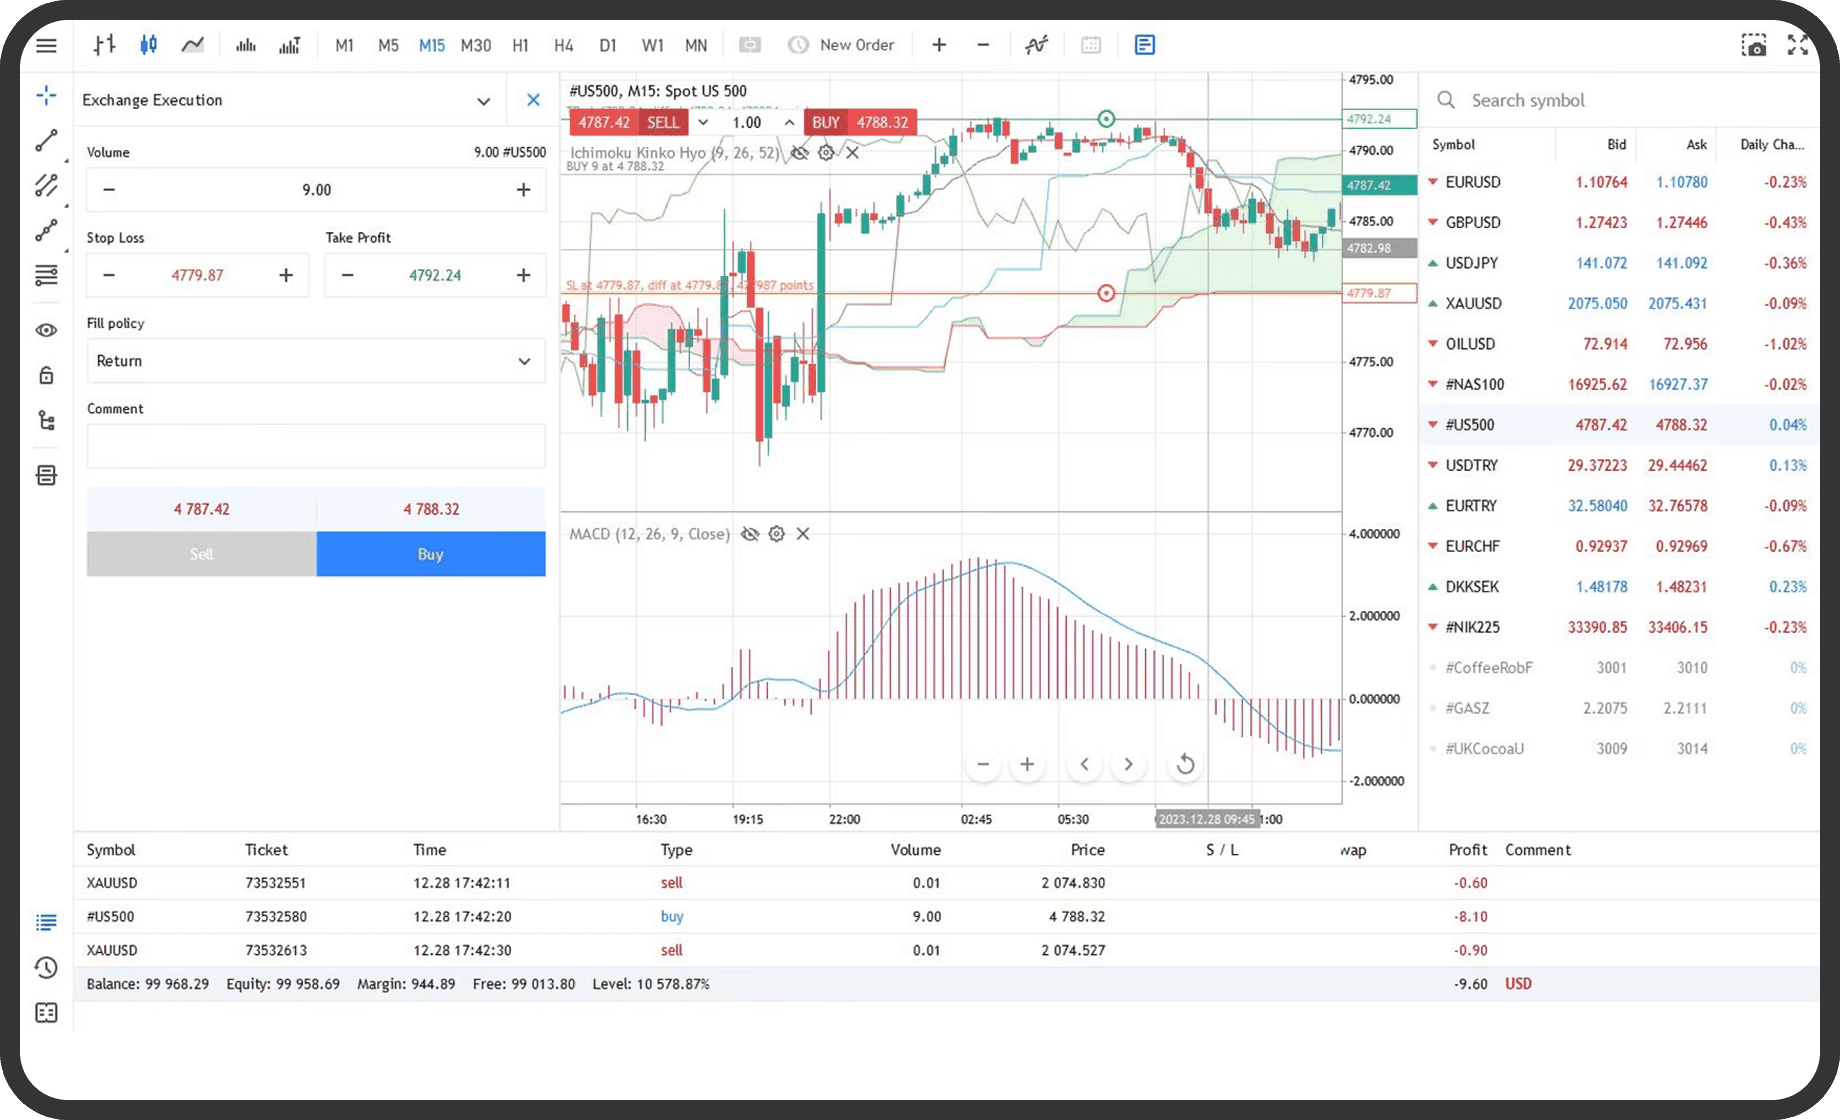
Say the US 500 is quoted 4787.4 / 4788.3 — a spread of 0.9 points. You buy one contract at $1 per point.
Opening costs you $0.90. If you close the same day, that is the whole cost. The index has to rise by 0.9 points, on a level near 4,800, for you to break even — roughly two hundredths of one percent. This is why indices attract short-term traders: the entry cost is small relative to how far the instrument routinely moves in a session.
Hold it overnight and financing applies to the full position value, not your margin. At around 4,788 a point with a $1 contract, the position is worth roughly $4,788; at approximately 7% a year that is close to $0.92 a night. Held a month, financing has cost about as much as thirty entries.
Margin is the other number to know. At 100:1, that same $4,788 position needs about $48 — which is exactly why indices are easy to over-trade. A $2,000 account can open forty of them. It should not.
Trading Indices with Ultimo
Ultimo Securities offers CFDs on major global indices alongside forex, metals and commodities, all on MetaTrader 5 with institutional-grade execution. Open an account in minutes and trade the world's markets from one platform.
Written by the Ultimo Research Desk and checked against our own contract specifications and client agreement before publication; reviewed again when those change. Educational only — nothing here is a recommendation to trade. Spotted an error? Tell us.
Ready to see how indices trades at Ultimo?
Indices trading