8 minute read · Ultimo Research Desk · Reviewed 5 Sept 2026
Volume and On-Balance Volume: What They Measure and When They Lie
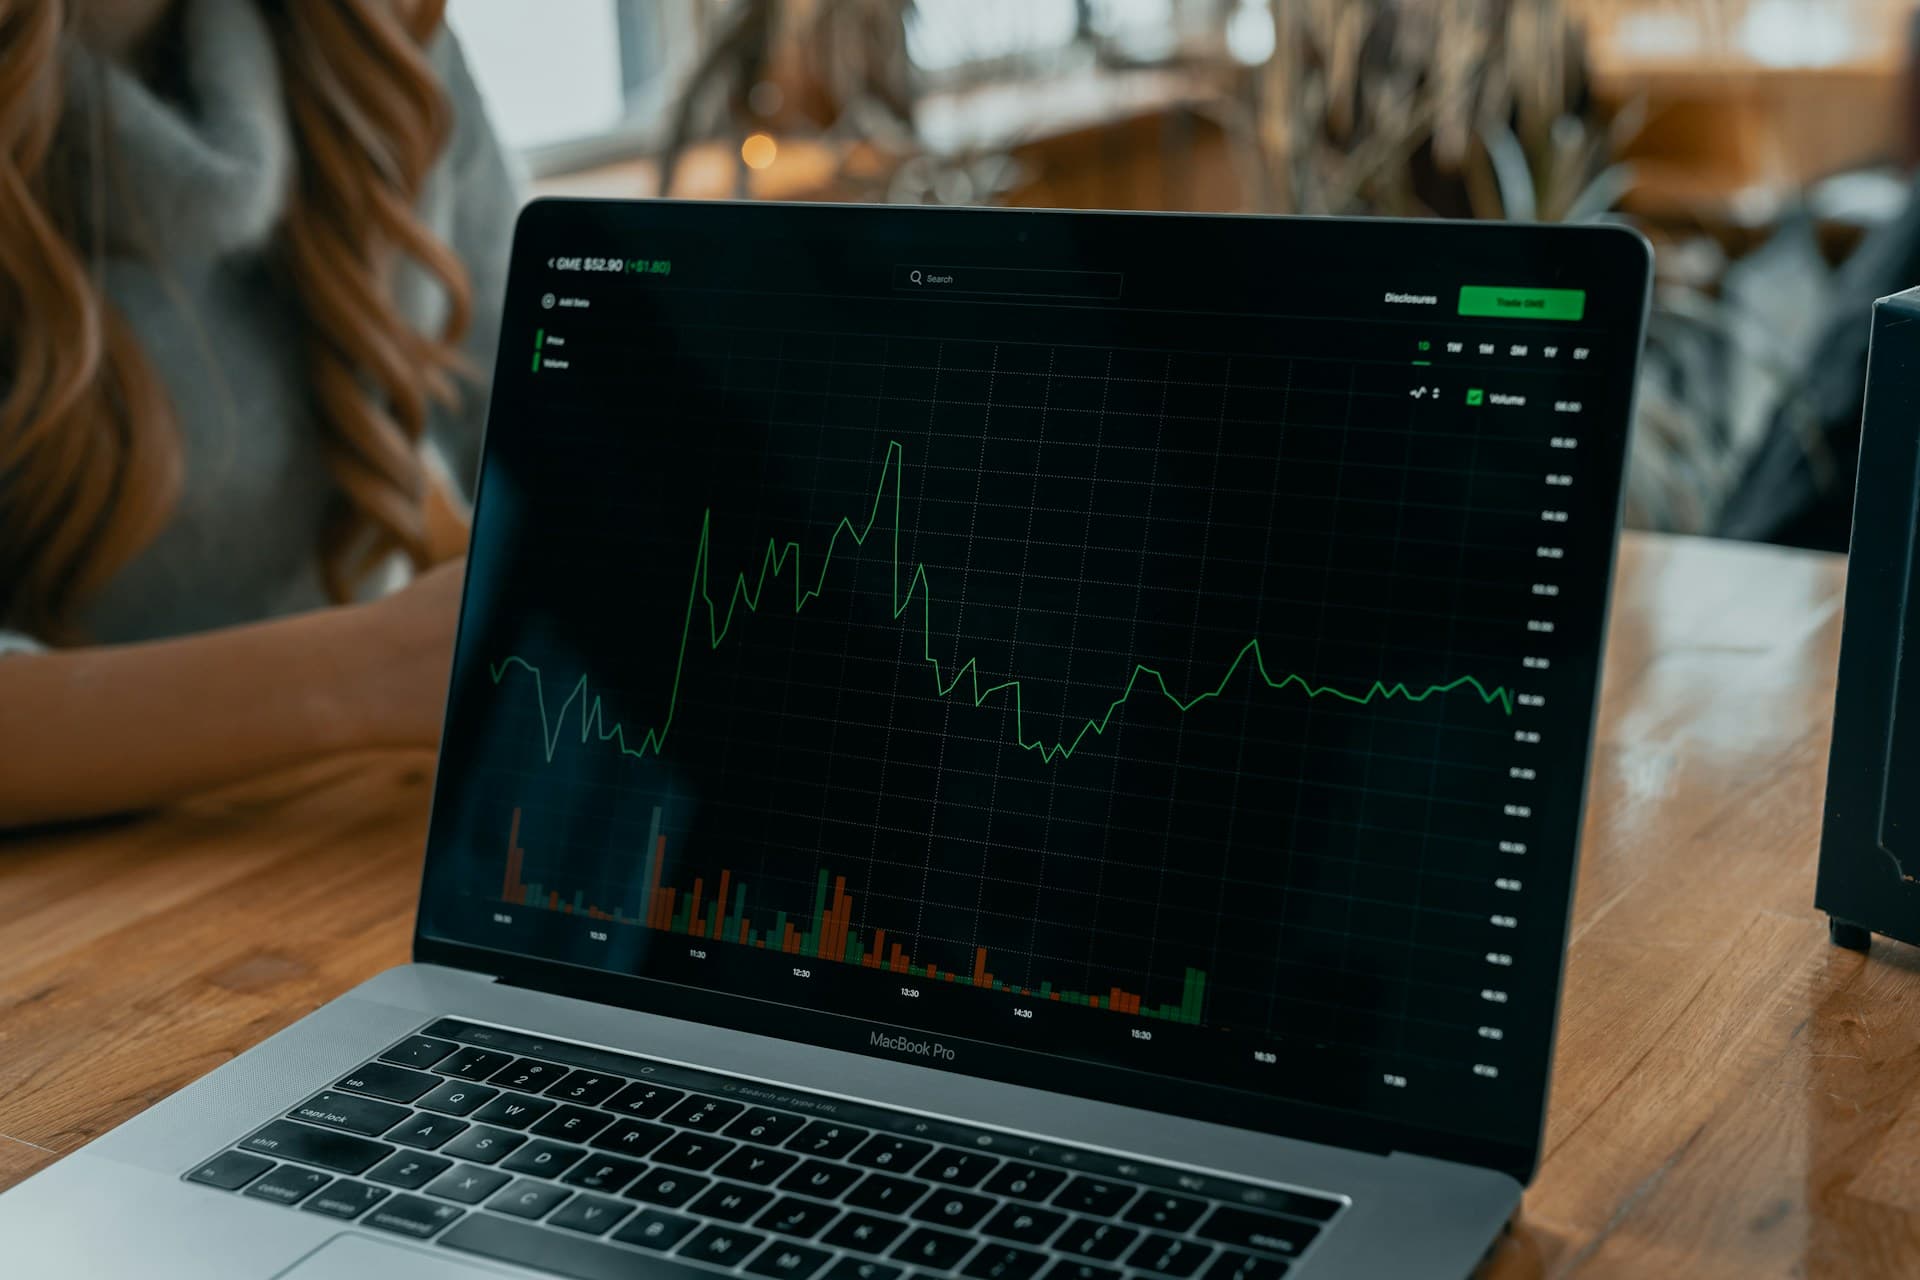
Volume is how much trading happened in a bar. On-balance volume adds each bar's volume to a running total when the close was up and subtracts it when the close was down, so the line drifts in the direction the bigger bars were closing. Rising OBV means more volume has come on up-closes than down-closes. That is a real fact about the data.
Both lie in the same way: high volume gets read as "buying". Every trade has a buyer and a seller; volume tells you they were busy, not which one was in a hurry. And on a CFD or spot forex chart, the "volume" is not volume at all — it is the number of price updates in the bar, a proxy that can rise because a quote feed got busier. Read the next section before trusting a volume bar on MetaTrader 5.
What they measure
On an exchange, volume is contracts or shares traded, reported by the venue. Forex is over-the-counter: there is no venue and no consolidated count, so MT5 shows tick volume — how many times the price changed during the bar. Tick volume correlates with real activity reasonably well most of the time and badly at the worst times: a fast, thin market can print a flood of ticks on very little money. Index and commodity CFDs inherit whatever the price source provides, which is usually also ticks.
Joseph Granville introduced OBV in 1963 on the theory that volume moves before price. The absolute level of the line is meaningless — it depends on where you started counting — so OBV is read by its slope, its highs and lows, and whether it agrees with price.
The formula, in words
Start OBV anywhere (zero). Each bar: if the close is above the previous close, add the bar's volume; if below, subtract it; if unchanged, leave it.
Only the sign of the close-to-close change is used. A bar that gained 0.01 on huge volume and a bar that gained 3% on huge volume contribute identically. Nothing about where in the bar the volume arrived, or which way price travelled inside it, enters the line.
Worked example
OBV starts at 1,000. Day 1: close up, volume 500 → 1,500. Day 2: close down, volume 300 → 1,200. Day 3: close unchanged, volume 400 → 1,200; the 400 is ignored. Three days of activity, one number, and the busiest day of the three (day 1) is the only one that moved the line up.
How they are read
Volume rising with a price move is called confirmation; a breakout on thin volume gets a second look. Those are hypotheses about participation, not laws. Relative volume — this hour versus the same hour last week, this bar versus the 20-bar average — is more useful than a raw number, especially in markets whose activity has a daily rhythm; the market hours tool shows where that rhythm peaks.
OBV is read against price. Price makes a higher high, OBV does not: the new high came with less net up-volume. OBV makes a new high first: called "accumulation", though the line cannot distinguish accumulation from short-covering, index rebalancing or a change in the data feed.
When they lie
Coverage changes. A holiday, a venue outage, a contract roll, a feed reconnecting — each makes a bar look unusual for reasons that are not about the market. Tick volume and exchange volume are different quantities and comparing them is a mistake.
High volume is symmetric. OBV's sign rule is crude: a bar that went up 2%, came back and closed up 0.01 is scored as a full up-volume bar. A divergence is a disagreement between two historical series, not a dated reversal signal. And the whole line can be shifted by one bad tick or one unadjusted split, without a single participant changing their mind.
What they do not tell you
Who traded, why, whether the move is justified, the probability of any return, or liquidity at a price you care about. Whether the volume field is real volume or a proxy is something you have to find out from the data source; the indicator will not tell you.
What the evidence actually says
Three papers come up in every serious discussion of indicators, so it is worth knowing what they found rather than what people say they found. Brock, Lakonishok and LeBaron (1992) tested simple moving-average and trading-range rules on ninety years of the Dow and found they carried information relative to a random benchmark. Sullivan, Timmermann and White (1999) then re-ran that idea across nearly eight thousand rule variants and showed that once you account for how many rules were tried, the best-looking one is far less impressive — the "data-snooping" result. Park and Irwin (2007) reviewed ninety-five later studies and found roughly half positive, a quarter negative and the rest mixed, with results weakening after transaction costs and risk adjustment.
The fair summary is neither that indicators work nor that they are worthless. It is that a fully specified rule — entry, exit, size, costs — can be tested, and most rules that look good on a chart do not survive the test. Whatever you build on this indicator, test it as a complete rule on data it has not seen.
Granville's book is a practitioner's theory, not a test. The academic literature on volume is large — the relationship between volume and volatility is one of the best-documented facts in finance — but it does not validate the OBV recursion specifically. Lo, Mamaysky and Wang's positive result was about chart patterns; the volume conditioning in their paper is not OBV.
Where it fits
Volume is not a vote on our signal pages, because the hourly data those pages use carries tick counts, and we would rather not dress a proxy up as a measurement. Read volume on MT5 the same way: as a rough gauge of how busy the feed was, and never as a count of money.
A note on risk: a big volume bar means the crowd was there. It does not say which way the crowd was leaning, and it is usually most misleading at exactly the moment the bar looks most dramatic.
Sources
- Granville, Joseph E., Granville's New Key to Stock Market Profits (1963): Google Books
- Park and Irwin (2007): DOI
- Lo, Mamaysky and Wang (2000): DOI
- Sullivan, Timmermann and White (1999): DOI
- Menkhoff and Taylor (2007): DOI
- Murphy, John J., Technical Analysis of the Financial Markets (1999): Google Books
Written by the Ultimo Research Desk and checked against our own contract specifications and client agreement before publication; reviewed again when those change. Educational only — nothing here is a recommendation to trade. Spotted an error? Tell us.