8 minute read · Ultimo Research Desk · Reviewed 5 Sept 2026
Bollinger Bands: What They Measure and When They Lie
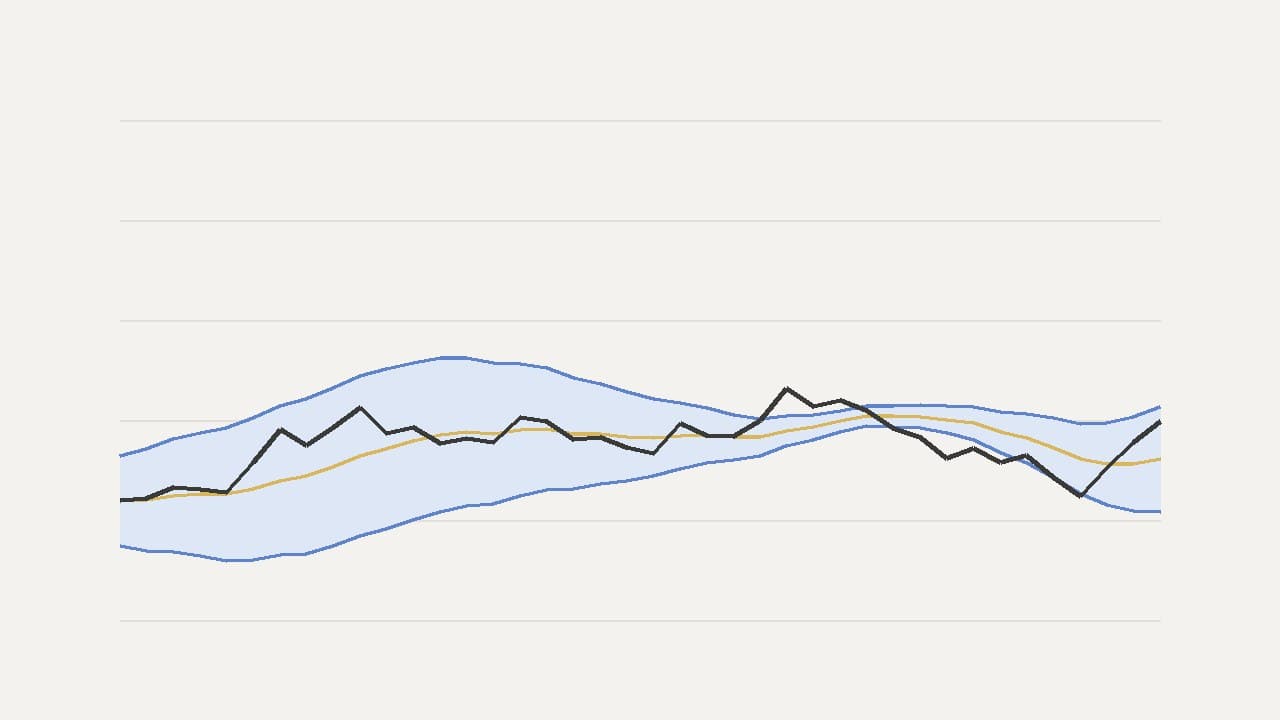
Bollinger Bands draw a 20-period moving average with a line two standard deviations above it and another two below. Where price sits between those lines tells you how far it is from its recent average, measured in units of its own recent variability. That is useful. What the bands do not tell you is that a touch of the upper band means "sell": in a strong trend price walks up the upper band for weeks, and every touch was a buy.
What they measure
John Bollinger's idea was to make the envelope around a moving average adapt to volatility instead of being a fixed percentage. When recent closes are widely dispersed the bands are wide; when they cluster, the bands narrow. The narrowing is the famous "squeeze", and it means exactly one thing: recent variation has been small. It does not say which way the next expansion goes.
A close at the upper band is high relative to the recent average and dispersion. It is not high relative to earnings, to another asset, or to where the price will be next month.
The formula, in words
For n periods (20 by default) and a multiplier k (2 by default):
- Middle band = the n-period simple moving average of closes.
- Standard deviation of those same n closes around that average.
- Upper band = middle + k × standard deviation.
- Lower band = middle − k × standard deviation.
One detail bites: some platforms divide by n (population) and others by n − 1 (sample) when computing the deviation. The bands differ slightly, and two charts of the same market will not quite agree.
Worked example
Five closes with mean 100 and deviations −2, −1, 0, +1, +2. Squared deviations sum to 4 + 1 + 0 + 1 + 4 = 10. Population variance 10 ÷ 5 = 2; standard deviation √2 = 1.414. With k = 2: upper band = 100 + 2.83 = 102.83, lower band = 100 − 2.83 = 97.17. With the sample convention, variance is 10 ÷ 4 = 2.5, deviation 1.581, and the bands sit at 103.16 and 96.84 — same market, half a point wider.
How they are read
A band touch is a location, not a direction. In a range, traders look for price to return towards the middle band after touching an outer one. In a trend, repeated closes near one band show persistent pressure, not exhaustion. Knowing which regime you are in comes from somewhere else — the moving averages, the higher timeframe, the calendar.
Band width (upper minus lower, often divided by the middle for scale) is a volatility measure in its own right. Rising width says dispersion is increasing; falling says it is contracting. Neither says who will win the next move. Combining the bands with a momentum oscillator adds context and also adds another parameter you could have chosen after looking at the answer.
When they lie
The statistical envelope gets mistaken for a ceiling and a floor. Standard deviation is backward-looking: it only widens after the big move has begun, which means the bands are narrowest at exactly the moment a breakout is about to make them look wrong.
Two standard deviations sounds like "95% of prices should be inside". It is not: that figure assumes a stable normal distribution, and financial returns are not one. Gaps, limit moves, thin sessions and news repricing all put price outside a band because the new price is the information, not an error waiting to be corrected. A squeeze can last far longer than expected, and a breakout from it can fail in one bar.
What they do not tell you
Fair value, the probability of a reversal, why volatility changed, which way a breakout resolves, or how big the position should be. Nothing distinguishes a fundamental repricing from a temporary overshoot; that is the question, and the bands do not answer it.
What the evidence actually says
Three papers come up in every serious discussion of indicators, so it is worth knowing what they found rather than what people say they found. Brock, Lakonishok and LeBaron (1992) tested simple moving-average and trading-range rules on ninety years of the Dow and found they carried information relative to a random benchmark. Sullivan, Timmermann and White (1999) then re-ran that idea across nearly eight thousand rule variants and showed that once you account for how many rules were tried, the best-looking one is far less impressive — the "data-snooping" result. Park and Irwin (2007) reviewed ninety-five later studies and found roughly half positive, a quarter negative and the rest mixed, with results weakening after transaction costs and risk adjustment.
The fair summary is neither that indicators work nor that they are worthless. It is that a fully specified rule — entry, exit, size, costs — can be tested, and most rules that look good on a chart do not survive the test. Whatever you build on this indicator, test it as a complete rule on data it has not seen.
The one paper that tested Bollinger Bands directly is Lento, Gradojevic and Wright (2007): across the markets and years they examined, band rules did not consistently beat buy-and-hold after costs, and a contrarian version (fade the touch) changed the result. Useful, specific and negative — and still only about the rules they defined.
Where they fit
The bands are not among the votes on our signal pages, because a band touch is deliberately ambiguous — location, not direction. They pair naturally with ATR, which measures the same volatility in price units instead of standard deviations, and which is the better tool for placing a stop.
A note on risk: a narrow band is a description of the recent past, not a coiled spring with a known direction. The position must survive the expansion going either way.
Sources
- Bollinger, John, Bollinger on Bollinger Bands (2001): catalogue record
- Lento, Gradojevic and Wright (2007), "Investment information content in Bollinger Bands?": DOI
- Park and Irwin (2007): DOI
- Sullivan, Timmermann and White (1999): DOI
- Lo, Mamaysky and Wang (2000): DOI
- Murphy, John J., Technical Analysis of the Financial Markets (1999): Google Books
Written by the Ultimo Research Desk and checked against our own contract specifications and client agreement before publication; reviewed again when those change. Educational only — nothing here is a recommendation to trade. Spotted an error? Tell us.