8 minute read · Ultimo Research Desk · Reviewed 5 Sept 2026
Simple vs Exponential Moving Averages: What They Measure and When They Lie
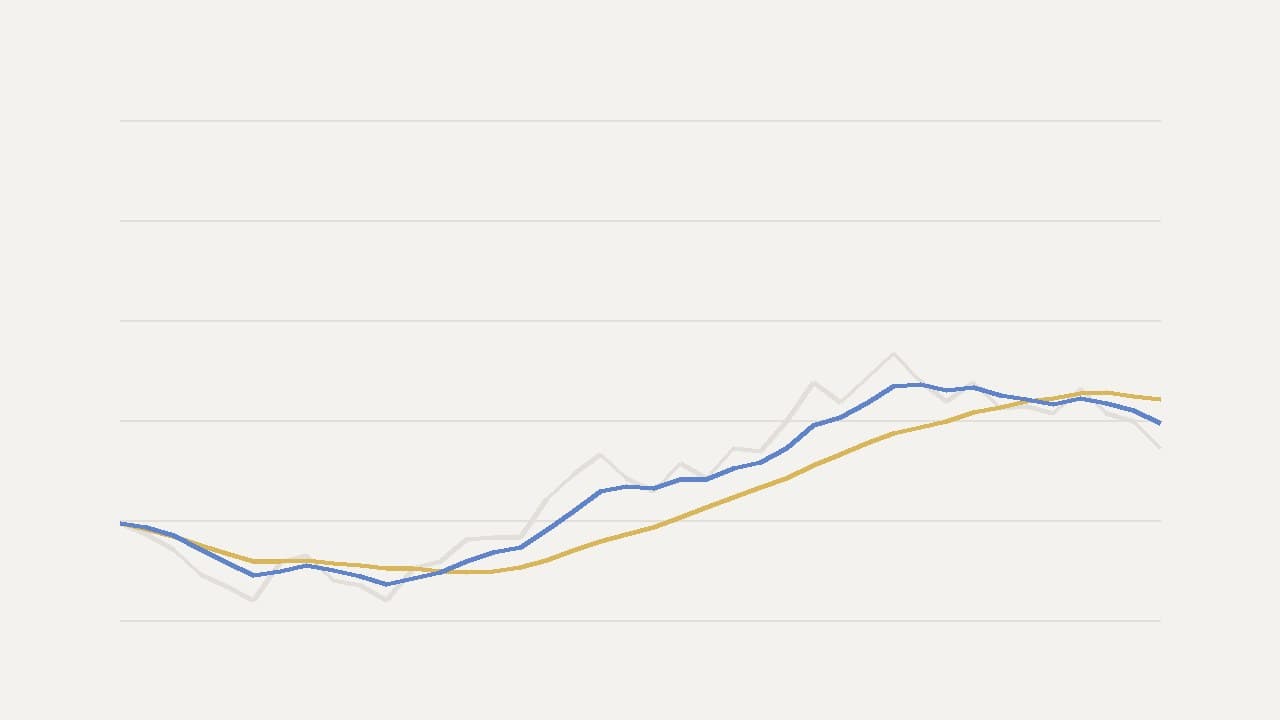
A moving average is the average price over the last n periods, redrawn every time a period closes. A simple moving average gives each of those closes the same weight. An exponential moving average gives the newest close the most weight and each older one a little less. That is the entire difference: a weighting choice, not a different kind of knowledge.
Both lie in the same two places. In a sideways market, price crosses the average — and a fast average crosses a slow one — again and again without follow-through. And at a sudden turn, the average lags by construction: the average of the last fifty hours cannot know about the fifty-first. Our hourly readings use SMA 20, 50 and 200 against price, and an EMA 10 against an EMA 30, as separate votes precisely because none of them is trusted alone.
What they measure
An average smooths noise. The length sets the trade-off: a 5-period average hugs price and is noisy, a 200-period average barely moves and is the long-term trend reference most of the market watches. An average that is rising says the average of the window is rising — it does not say every recent price is rising.
The SMA is easy to audit: the newest close comes in, the oldest drops out. The catch is that the oldest close leaving can move the line as much as the newest arriving, so an SMA can "turn" because of something that happened n periods ago. The EMA never fully forgets anything, which makes it smoother at the far end and faster at the near end.
Exponential smoothing came out of forecasting work in the 1950s — Robert G. Brown's inventory models — and was borrowed by charting later. Nobody invented the SMA; it is arithmetic.
The formulas, in words
SMA = the sum of the last n closes ÷ n.
EMA today = α × today's close + (1 − α) × yesterday's EMA, where α = 2 ÷ (n + 1). The first EMA is usually seeded with the n-period SMA.
Worked example
Five closes: 100, 102, 101, 104, 103. Sum 510; SMA 5 = 102.
Five-period EMA: α = 2 ÷ 6 = 0.333. If yesterday's EMA was 101 and today's close is 105, today's EMA = 0.333 × 10⁵ + 0.667 × 101 = 102.33. Today's close received a third of the weight; everything before it, two thirds. Tomorrow that 102.33 becomes the two-thirds part.
Two correct implementations can differ in the first few dozen bars because of the seed. Compare values only after the series has run long enough to forget it.
How they are used
One average: is price above or below its smoothed reference? Two averages: has the faster one crossed the slower one? The 50/200 cross on a daily chart has a name ("golden cross", "death cross") and enough followers that it sometimes moves price by being watched. It also arrives, by construction, well after the trend it announces has begun.
Averages are also used as "dynamic support" — price bouncing off the 20 EMA in a trend. The more honest phrasing is a dynamic reference zone: price goes through it repeatedly whenever the trend pauses.
The length must be chosen before you look at the results. Trying forty lengths and keeping the one that looked best on last year's chart is the experiment Sullivan, Timmermann and White wrote their paper about.
When they lie
In a range, every small swing produces a cross with nothing behind it. After a gap, the average catches up gradually and the chart shows price "far above the average" for reasons that have nothing to do with momentum. And an average of prices contains no earnings, no rates, no macro — treating it as a valuation line is a category error.
The line also depends on the data. Adjusted or unadjusted prices, which time zone defines the daily close, missing candles, contract rolls: each changes it. A crossover computed from the same prices you can already see on the chart is not new information.
What they do not tell you
Fair value, expected return, volatility, liquidity, or the cause of the move. Nothing about where the stop goes or how big the position should be. Nothing about breadth, unless computed across a basket on purpose.
What the evidence actually says
Three papers come up in every serious discussion of indicators, so it is worth knowing what they found rather than what people say they found. Brock, Lakonishok and LeBaron (1992) tested simple moving-average and trading-range rules on ninety years of the Dow and found they carried information relative to a random benchmark. Sullivan, Timmermann and White (1999) then re-ran that idea across nearly eight thousand rule variants and showed that once you account for how many rules were tried, the best-looking one is far less impressive — the "data-snooping" result. Park and Irwin (2007) reviewed ninety-five later studies and found roughly half positive, a quarter negative and the rest mixed, with results weakening after transaction costs and risk adjustment.
The fair summary is neither that indicators work nor that they are worthless. It is that a fully specified rule — entry, exit, size, costs — can be tested, and most rules that look good on a chart do not survive the test. Whatever you build on this indicator, test it as a complete rule on data it has not seen.
Moving averages are the one indicator family the classic studies tested directly. Brock, Lakonishok and LeBaron's positive result was for simple moving-average rules on the Dow to 1986; Sullivan, Timmermann and White's re-test found the best of those rules did not hold up out of sample after 1986. That pair of results is the whole lesson in miniature.
Where to see them live
Every page under Technical signals shows price against the SMA 20, 50 and 200 and the EMA 10/30 cross on the hourly chart. The MACD guide shows what happens when you subtract two EMAs from each other.
A note on risk: an average tells you what the trend has been. It never tells you what it is about to do, which is the only thing anyone wants it for.
Sources
- Brown, Robert G., Statistical Forecasting for Inventory Control (1959): Google Books
- Murphy, John J., Technical Analysis of the Financial Markets (1999): Google Books
- Brock, Lakonishok and LeBaron (1992): DOI
- Sullivan, Timmermann and White (1999): DOI
- Park and Irwin (2007): DOI
- Lo, Mamaysky and Wang (2000): DOI
Written by the Ultimo Research Desk and checked against our own contract specifications and client agreement before publication; reviewed again when those change. Educational only — nothing here is a recommendation to trade. Spotted an error? Tell us.