8 minute read · Ultimo Research Desk · Reviewed 5 Sept 2026
MACD: What It Measures and When It Lies

MACD is the distance between a fast exponential moving average and a slow one, with a second average drawn through that distance so you can see it turning. When the MACD line crosses above its signal line, the fast average is pulling away from the slow one on the upside — momentum is building. That is the whole idea, and it is a good one.
It lies in a range. Two averages of the same choppy price cross each other again and again, each cross arriving after the small move that caused it has finished. It also lies at a gap, when one price shock produces a dramatic cross that reflects one candle, not a change of trend. Our hourly readings use MACD 12/26/9 as one vote, weighted no more than the others, for that reason.
What it measures
Gerald Appel built MACD in the late 1970s from three parts. The MACD line is the 12-period EMA minus the 26-period EMA. The signal line is a 9-period EMA of the MACD line. The histogram is MACD minus signal.
A positive MACD line means the fast average is above the slow one. Its size depends on the price level of the instrument — a MACD of 3 on an index at 5,000 and a MACD of 0.003 on a currency pair at 1.08 can describe the same momentum — so raw values are not comparable across markets.
The formula, in words
An EMA of length n updates as EMA today = α × close + (1 − α) × EMA yesterday, with α = 2 ÷ (n + 1). For 12 periods α is 0.154; for 26 it is 0.074; for 9 it is 0.2. Then:
- MACD line = EMA 12 − EMA 26
- Signal line = 9-period EMA of the MACD line
- Histogram = MACD line − signal line
The first EMA has to start somewhere, usually the simple average of the first n closes. Platforms differ in that seed, so early values differ; after a few hundred bars the difference is gone.
Worked example
Suppose the 12-period EMA is 105 and the 26-period EMA is 102. MACD = 105 − 102 = 3. If the signal EMA currently reads 2, the histogram is 3 − 2 = 1: the MACD line is above its signal, and the gap between them is one price unit.
To see the EMA weighting itself: a 5-period EMA has α = 2 ÷ 6 = 0.333. If yesterday's EMA was 101 and today closes at 105, today's EMA is 0.333 × 10⁵ + 0.667 × 101 = 102.33. One third of today's close, two thirds of everything before it.
How it is read
The signal-line cross is the classic entry: MACD above signal is bullish, below is bearish. The zero-line cross is slower and cleaner: above zero the fast EMA is above the slow one, which is the definition of an uptrend in moving-average terms.
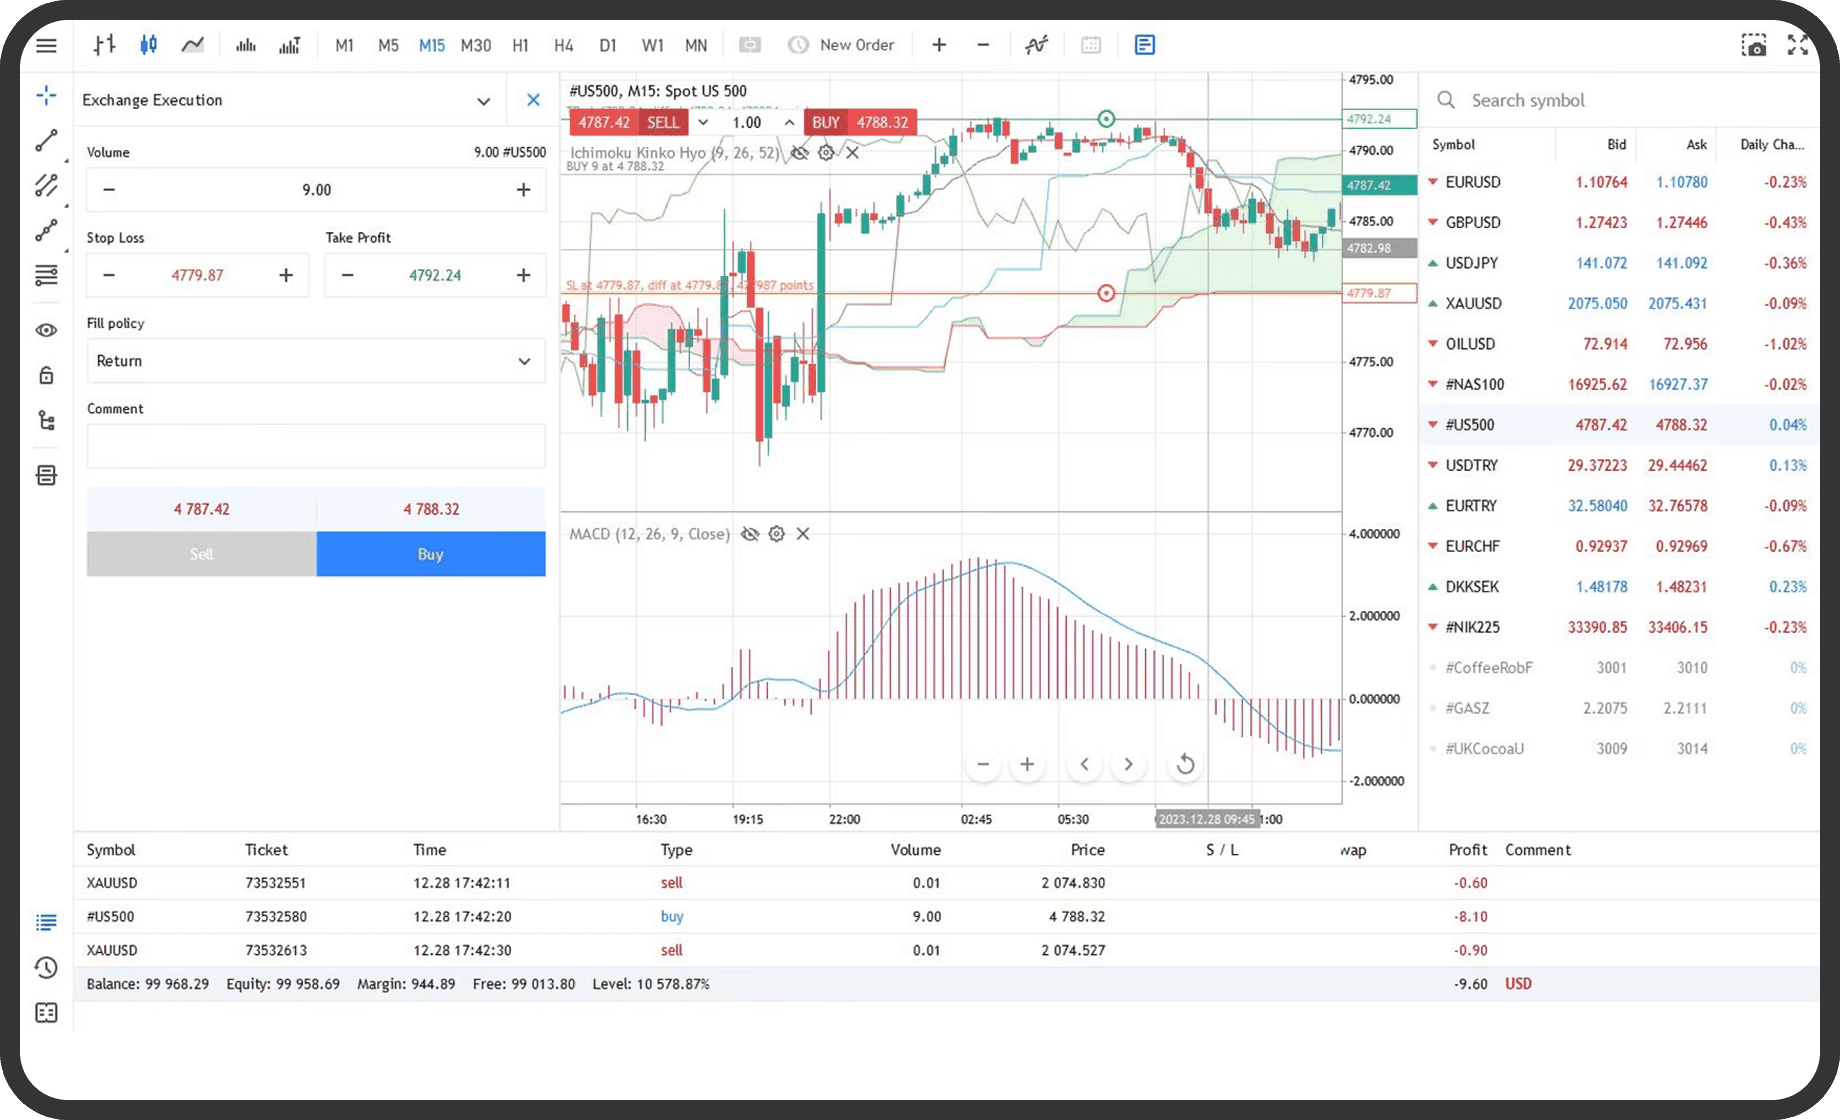
The histogram is where the early information is. If it stops growing while MACD is still positive, the two averages have stopped separating — momentum is slowing before any cross prints. Divergence (price makes a new high, MACD does not) is the same reading in another form: the new high came with less momentum than the last one. Both are reasons to look, not orders to act.
When it lies
MACD is built from lag, twice over. Every EMA is behind price; the signal line is behind the MACD line. By the time a cross is visible, part of the move has already happened. Lengthening the settings reduces the number of false crosses and increases the lag; shortening them does the reverse. No setting removes the trade-off; it only chooses where to pay.
The histogram is often described as "acceleration". It is the difference between two smoothed series and nothing more — not order flow, not volume, not volatility. A textbook divergence fails the moment the market receives a piece of news it did not have when the averages were computed.
What it does not tell you
Value, cause, liquidity, the probability of any particular outcome, or the size of a sensible position. A bullish cross knows nothing about your time horizon or how much you can afford to be wrong by.
What the evidence actually says
Three papers come up in every serious discussion of indicators, so it is worth knowing what they found rather than what people say they found. Brock, Lakonishok and LeBaron (1992) tested simple moving-average and trading-range rules on ninety years of the Dow and found they carried information relative to a random benchmark. Sullivan, Timmermann and White (1999) then re-ran that idea across nearly eight thousand rule variants and showed that once you account for how many rules were tried, the best-looking one is far less impressive — the "data-snooping" result. Park and Irwin (2007) reviewed ninety-five later studies and found roughly half positive, a quarter negative and the rest mixed, with results weakening after transaction costs and risk adjustment.
The fair summary is neither that indicators work nor that they are worthless. It is that a fully specified rule — entry, exit, size, costs — can be tested, and most rules that look good on a chart do not survive the test. Whatever you build on this indicator, test it as a complete rule on data it has not seen.
Chong and Ng (2008) tested MACD rules directly on the FT30 and found some specifications informative in that sample; Brock, Lakonishok and LeBaron's moving-average rules are cousins of MACD rather than the same thing. Neither result transfers to a different market and a different decade without being re-tested there.
Where to see it live
Each instrument page under Technical signals prints the current MACD 12/26/9 on the hourly chart and whether it sits above or below its signal line. The moving averages guide explains the EMAs it is built from.
A note on risk: a cross tells you two averages changed order. It does not tell you where the stop goes; put that where the idea is wrong, and size from there.
Sources
- Appel, Gerald, Technical Analysis: Power Tools for Active Investors (2005): Google Books
- Chong and Ng (2008), "Technical analysis and the London stock exchange: testing the MACD and RSI rules using the FT30": DOI
- Brock, Lakonishok and LeBaron (1992): DOI
- Park and Irwin (2007): DOI
- Sullivan, Timmermann and White (1999): DOI
- Lo, Mamaysky and Wang (2000): DOI
Written by the Ultimo Research Desk and checked against our own contract specifications and client agreement before publication; reviewed again when those change. Educational only — nothing here is a recommendation to trade. Spotted an error? Tell us.