7 minute read · Ultimo Research Desk · Reviewed 5 Sept 2026
Stochastic Oscillator: What It Measures and When It Lies
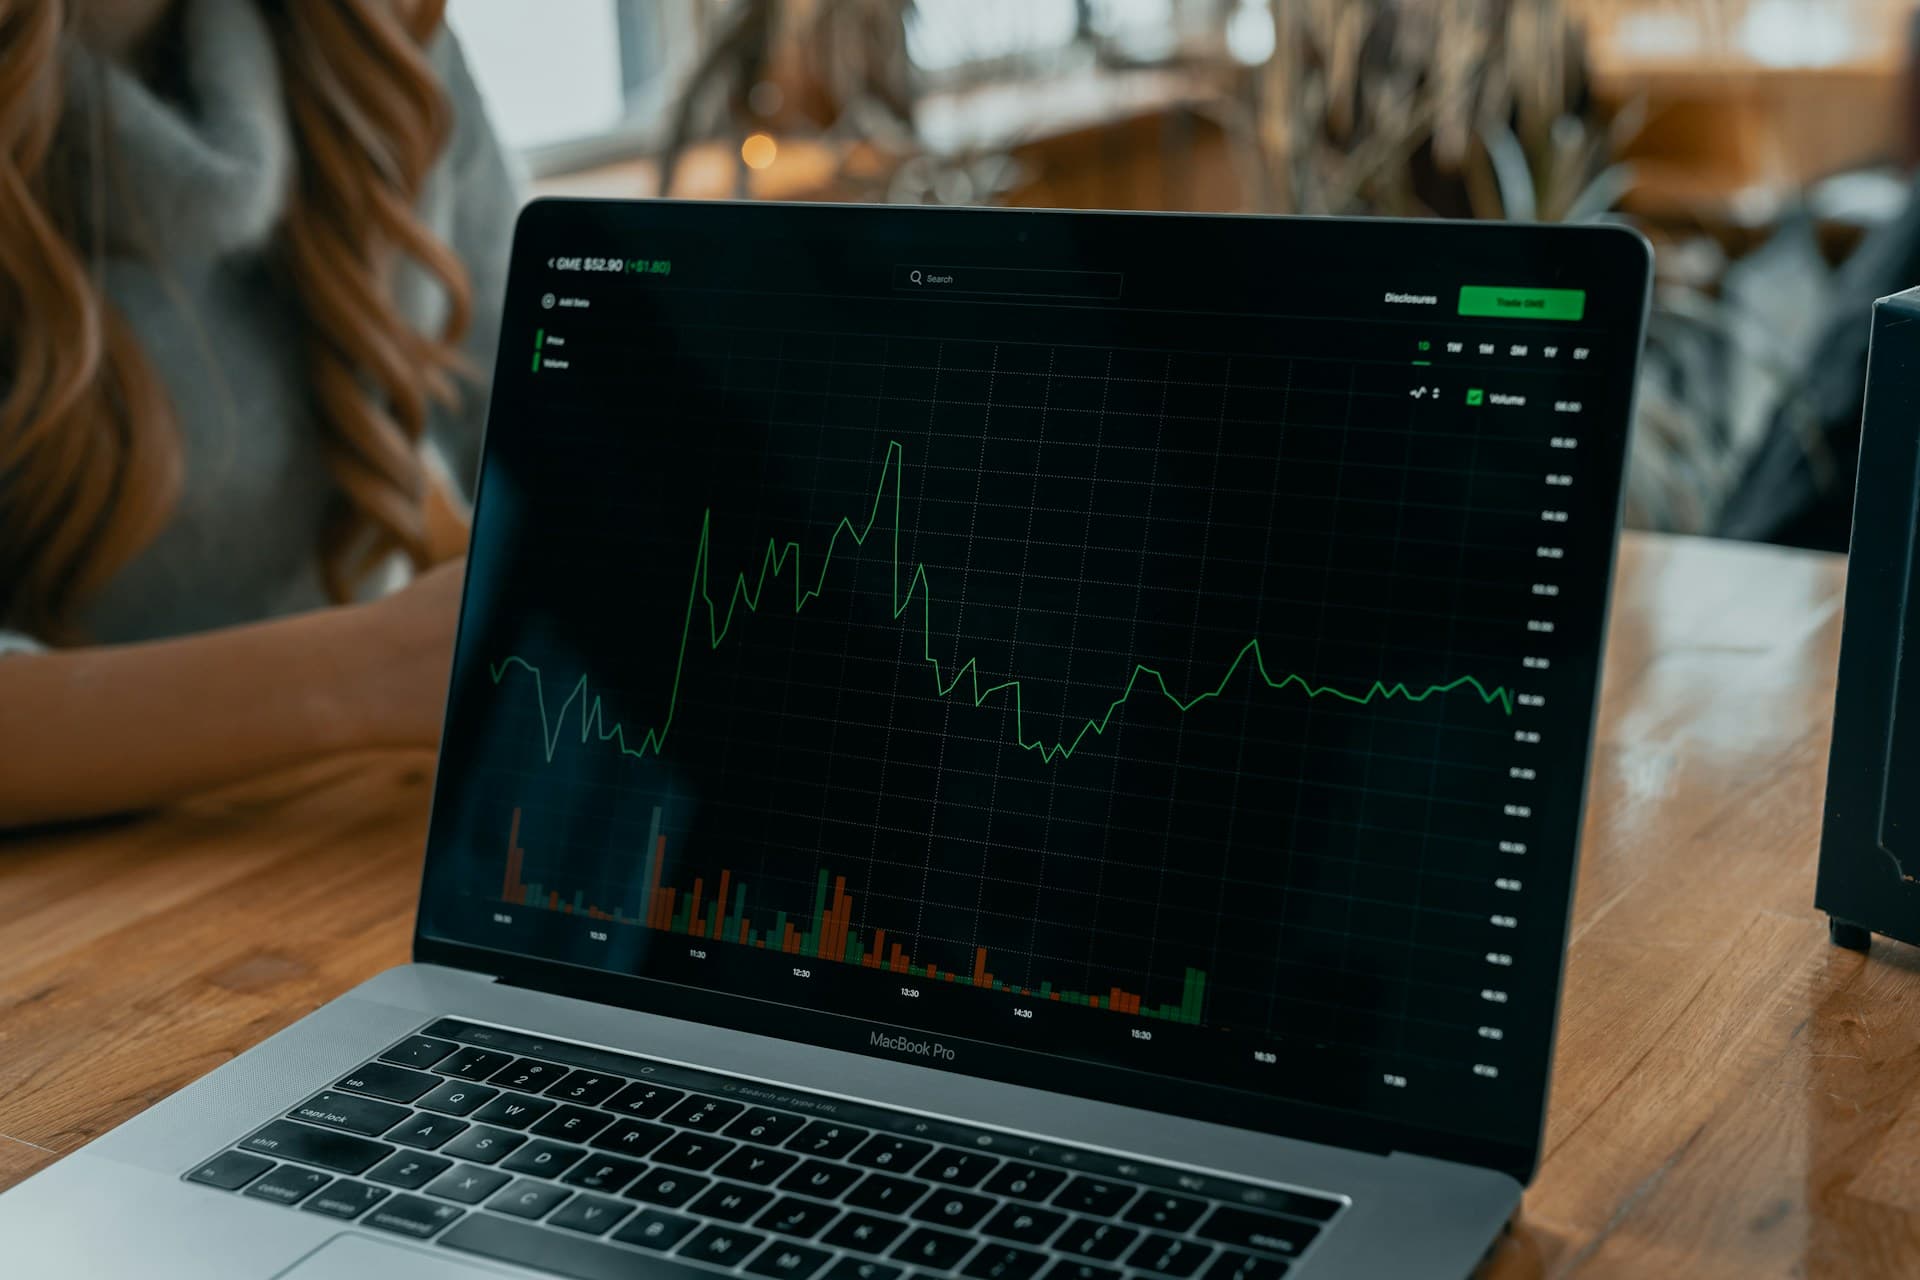
The stochastic oscillator answers one question: where did the latest close land inside the range of the last 14 periods? At the top of the range it reads near 100; at the bottom, near 0. That is a genuinely useful thing to know, because in a trend closes cluster near one end of the range, and in a turn they stop doing so.
It lies when 80 is read as "sell" and 20 as "buy". A market that keeps closing near its highs is a market going up, and the stochastic will sit above 80 for as long as that lasts. Our hourly readings use the stochastic 14/3 as one vote, and the pages show how often it stays "overbought" while the trend continues.
What it measures
George Lane taught the method in the 1950s and set it out in print in 1984. The idea is that closing position within the range changes before price itself turns: in an uptrend that is tiring, price still makes highs, but closes drift away from them.
There are two lines. %K is the raw location of the close in the range. %D is a 3-period simple average of %K. "Slow" and "full" stochastics smooth %K itself before taking %D, which makes the chart calmer and later. The 80 and 20 lines are conventions, not thresholds with any property of their own.
The formula, in words
%K = 100 × (close − lowest low of n periods) ÷ (highest high of n periods − lowest low of n periods)
%D = (%K today + %K yesterday + %K two periods ago) ÷ 3
If the highest high equals the lowest low the denominator is zero; a proper implementation defines what happens on that bar rather than dividing by it.
Worked example
Over 14 periods the highest high is 110 and the lowest low is 90; the current close is 106. Range 20. %K = 100 × (106 − 90) ÷ 20 = 80. If the last three %K values were 70, 75 and 80, %D = 225 ÷ 3 = 75. The close is in the top fifth of its two-week range, and it has been climbing through that range for three bars.
How it is read
%K crossing above %D is read as improving short-term momentum, below as weakening. A cross that happens in an extreme zone gets more attention than one in the middle, and neither validates itself. Divergence — a new price high with a lower stochastic high — says the new high closed further from the top of its range than the previous one did. That is worth a look. It also happens repeatedly in every long trend.
The stochastic is at its best in a bounded range where price genuinely travels between visible highs and lows. In a trend the better question is not "is it overbought?" but "is it confirming persistent pressure?" — the same number, read the other way round.
When it lies
Overbought is not "must fall". A close near the top of the range is what a strong market looks like. Changing the look-back until the historical crosses look good is not analysis. Around a gap the range resets and the oscillator jumps because its denominator changed, not because anything happened to demand. Illiquid instruments record stale closes, and the location of a stale close inside a stale range means little.
Smoothing trades noise for lag. A slow stochastic produces a persuasive cross after price has already turned; a fast one produces five crosses per turn.
What it does not tell you
Fair value, cause, the probability of a reversal, the size of the next move, volume, liquidity, the calendar. Nothing about how much of the account a position should use.
What the evidence actually says
Three papers come up in every serious discussion of indicators, so it is worth knowing what they found rather than what people say they found. Brock, Lakonishok and LeBaron (1992) tested simple moving-average and trading-range rules on ninety years of the Dow and found they carried information relative to a random benchmark. Sullivan, Timmermann and White (1999) then re-ran that idea across nearly eight thousand rule variants and showed that once you account for how many rules were tried, the best-looking one is far less impressive — the "data-snooping" result. Park and Irwin (2007) reviewed ninety-five later studies and found roughly half positive, a quarter negative and the rest mixed, with results weakening after transaction costs and risk adjustment.
The fair summary is neither that indicators work nor that they are worthless. It is that a fully specified rule — entry, exit, size, costs — can be tested, and most rules that look good on a chart do not survive the test. Whatever you build on this indicator, test it as a complete rule on data it has not seen.
None of the classic studies tested the stochastic directly: Brock, Lakonishok and LeBaron tested averages and trading ranges, Lo, Mamaysky and Wang tested chart patterns. Anything you read about "the stochastic being proven" is somebody generalising from a paper about something else.
Where to see it live
Every instrument page under Technical signals shows the stochastic 14/3 on the hourly chart with its current reading and vote. The RSI guide covers the other bounded oscillator, which measures momentum from gains and losses rather than from range position; the two disagree more often than people expect.
A note on risk: an oscillator at 85 is a location, not a countdown. If the trade is against the trend, the stop has to be where the trend proves you wrong, not where the oscillator felt extreme.
Sources
- Lane, George C., "Lane's Stochastics", Technical Analysis of Stocks & Commodities (1984): archive
- Schade, G. A. Jr. (2011), on the origins of the stochastic and Lane's role: CMT Association
- Park and Irwin (2007): DOI
- Brock, Lakonishok and LeBaron (1992): DOI
- Sullivan, Timmermann and White (1999): DOI
- Lo, Mamaysky and Wang (2000): DOI
Written by the Ultimo Research Desk and checked against our own contract specifications and client agreement before publication; reviewed again when those change. Educational only — nothing here is a recommendation to trade. Spotted an error? Tell us.