9 minute read · Ultimo Research Desk · Reviewed 5 Sept 2026
Ichimoku Cloud: What It Measures and When It Lies
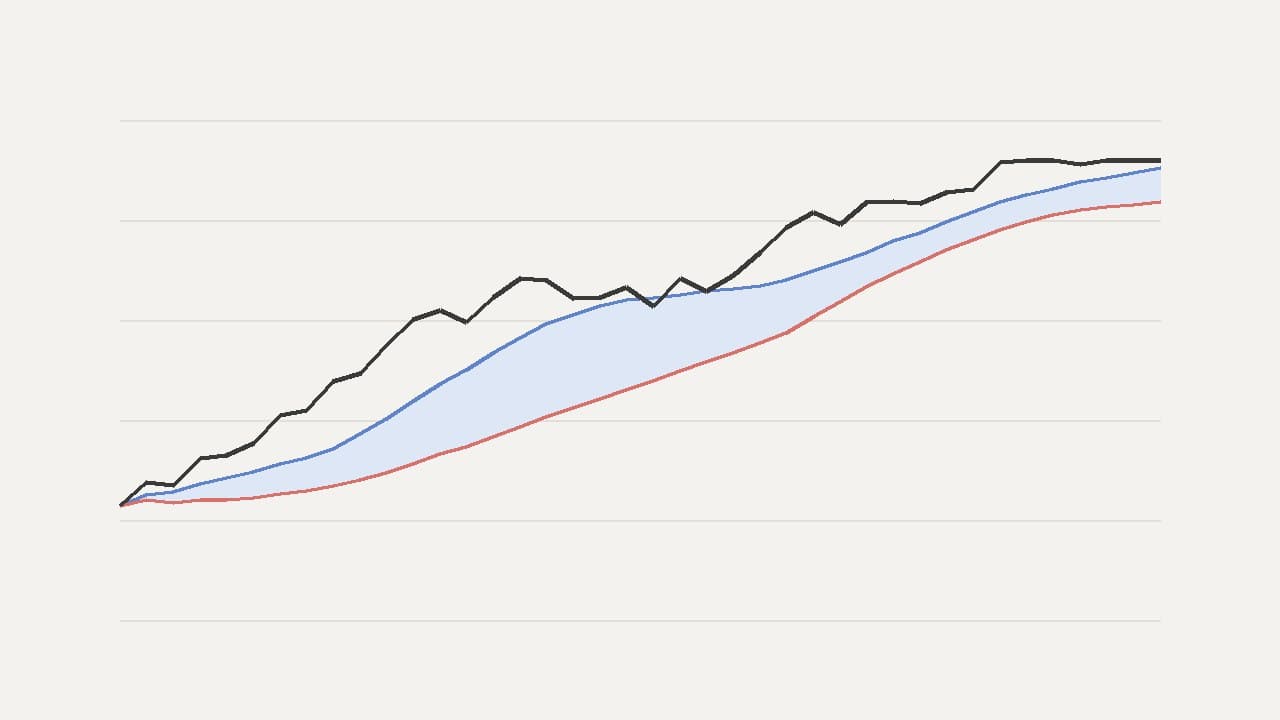
Ichimoku Kinko Hyo — "one-glance equilibrium chart" — is five lines computed from the midpoints of recent price ranges, with two of them shifted 26 bars into the future and one shifted 26 bars into the past. The shaded area between the two forward lines is the cloud. Price above the cloud is read as an uptrend, below as a downtrend, inside as undecided. It is the most complete single-indicator system in common use, and it is also the one most often misread.
It lies in one spectacular way: the cloud drawn to the right of today's price looks like a forecast, and it is not. Every value in it was computed from prices that already exist and then moved along the x-axis. Shifting a number 26 bars to the right does not make it know anything about those 26 bars.
What it measures
Goichi Hosoda developed the system in Japan over decades and published it in 1969. The default settings are 9, 26 and 52, chosen for a six-day Japanese trading week that no longer exists: 9 was a week and a half, 26 a month, 52 two months. They are conventions now, and changing them for a 24-hour market is a different model, not a tuning.
The five lines:
- Tenkan-sen (conversion): midpoint of the 9-period range.
- Kijun-sen (base): midpoint of the 26-period range.
- Senkou Span A: midpoint of Tenkan and Kijun, plotted 26 bars ahead.
- Senkou Span B: midpoint of the 52-period range, plotted 26 bars ahead.
- Chikou Span: today's close, plotted 26 bars back.
These are midpoints of highs and lows, not averages of closes — a range midpoint ignores everything that happened between the extremes, which makes the lines step rather than glide.
The formulas, in words
- Tenkan = (highest high of 9 + lowest low of 9) ÷ 2
- Kijun = (highest high of 26 + lowest low of 26) ÷ 2
- Span A = (Tenkan + Kijun) ÷ 2, shifted +26
- Span B = (highest high of 52 + lowest low of 52) ÷ 2, shifted +26
- Chikou = close, shifted −26
Worked example
9-period high 112, low 92: Tenkan = 102. 26-period high 120, low 80: Kijun = 100. Span A = (102 + 100) ÷ 2 = 101, drawn 26 bars ahead. 52-period high 140, low 60: Span B = 100, also 26 bars ahead. Today's close 108 is the Chikou value, drawn 26 bars back.
So the cloud that will sit under the price 26 bars from now spans 100 to 101: thin, because the short-term and long-term midpoints happen to agree. Today's close of 108 is above it. Nothing about the next 26 bars was used to draw any of this.
How it is read
Price versus cloud is the trend filter. Tenkan crossing Kijun is the trigger, graded by where it happens: above the cloud is a "strong" bullish cross, inside is "neutral", below is "weak". The cloud's thickness — the gap between Span A and B — is read as the strength of support or resistance; it is really the disagreement between a 26-period midpoint and a 52-period one. Chikou above the price of 26 bars ago is read as confirmation; it is the current close compared with an old close, which a two-line chart would show just as well.
Read honestly, Ichimoku is a compact way to see where price sits relative to several historical range midpoints at once. That is a legitimate thing to want at a glance.
When it lies
The look-ahead trap is the big one, and it bites in backtests: a rule that uses "price broke above the cloud" must use the cloud as it was drawn at that bar, which on most platforms means the values computed 26 bars earlier. Using the cloud you can see today to judge a signal from 20 bars ago is cheating, and it makes every Ichimoku backtest done on a chart look wonderful.
Five lines from one set of highs, lows and closes are not five confirmations. In a flat market they cluster and agree about nothing; in a shock they are all crossed in one bar. And the defaults are a 1960s Japanese calendar.
What it does not tell you
Value, cause, the probability of a cloud break, the size of the next move, position size, or anything fundamental. A thick cloud is not a wall.
What the evidence actually says
Three papers come up in every serious discussion of indicators, so it is worth knowing what they found rather than what people say they found. Brock, Lakonishok and LeBaron (1992) tested simple moving-average and trading-range rules on ninety years of the Dow and found they carried information relative to a random benchmark. Sullivan, Timmermann and White (1999) then re-ran that idea across nearly eight thousand rule variants and showed that once you account for how many rules were tried, the best-looking one is far less impressive — the "data-snooping" result. Park and Irwin (2007) reviewed ninety-five later studies and found roughly half positive, a quarter negative and the rest mixed, with results weakening after transaction costs and risk adjustment.
The fair summary is neither that indicators work nor that they are worthless. It is that a fully specified rule — entry, exit, size, costs — can be tested, and most rules that look good on a chart do not survive the test. Whatever you build on this indicator, test it as a complete rule on data it has not seen.
There is no accepted peer-reviewed evidence that the standard Ichimoku system carries a predictive edge across markets, and its many components — three settings, several crosses, cloud filters, Chikou confirmation — make it the kind of rule family Sullivan, Timmermann and White's result was written about. Menkhoff and Taylor's survey shows technical analysis is used heavily in FX; that is about use, not about results.
Where it fits
Ichimoku is not among the votes on our signal pages; the pages use single-purpose indicators whose vote can be explained in one line, and Ichimoku's vote depends on which of its rules you ask. Its trend-filter role is close to what the SMA 200 versus price vote does there.
A note on risk: the cloud drawn to the right of the price is a re-plot of the past, not a forecast. Do not size a position on it.
Sources
- Hosoda, Goichi, Ichimoku Kinko Hyo (1969), history and method: overview
- Linton, David, Cloud Charts: Trading Success with the Ichimoku Technique (2010): catalogue record
- Park and Irwin (2007): DOI
- Lo, Mamaysky and Wang (2000): DOI
- Sullivan, Timmermann and White (1999): DOI
- Menkhoff and Taylor (2007): DOI
Written by the Ultimo Research Desk and checked against our own contract specifications and client agreement before publication; reviewed again when those change. Educational only — nothing here is a recommendation to trade. Spotted an error? Tell us.