8 minute read · Ultimo Research Desk · Reviewed 5 Sept 2026
RSI: What It Measures and When It Lies
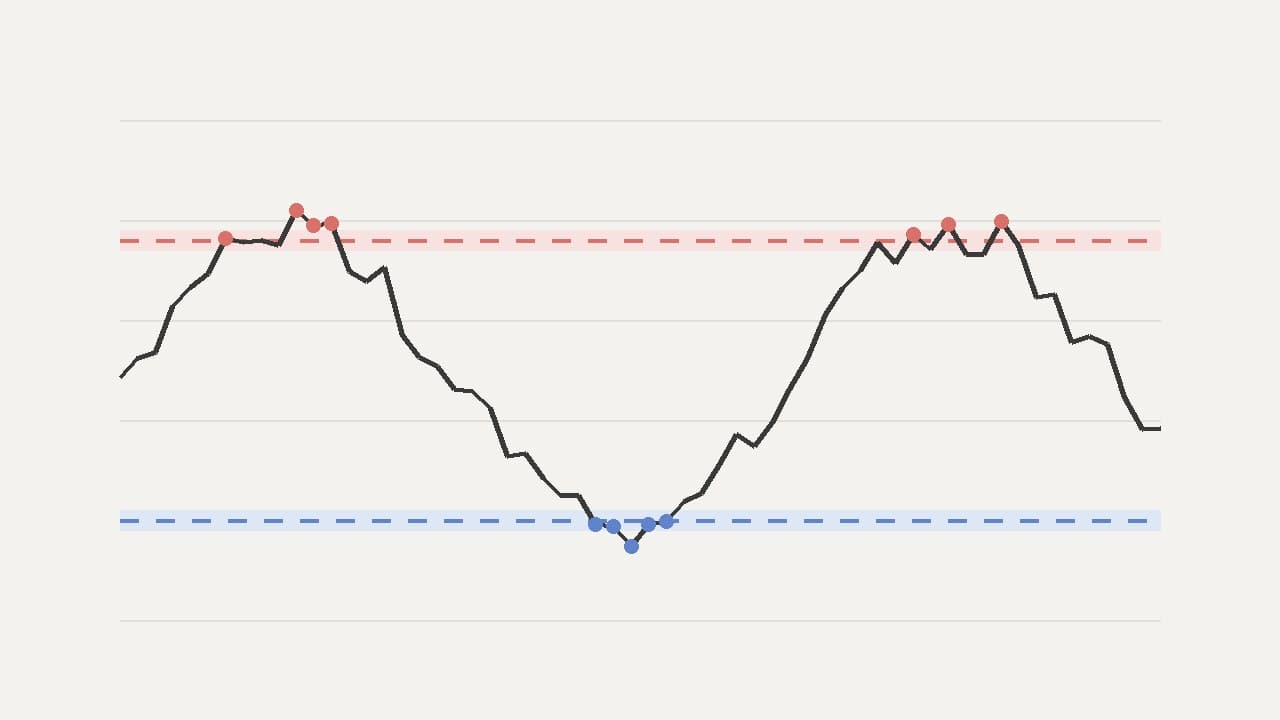
RSI is a number between 0 and 100 that says how big recent up-moves have been compared with recent down-moves. That is all it says. It does not say a market is expensive, cheap, or about to turn.
It lies in one specific way: in a strong trend it sits above 70 (or below 30) for days or weeks while price keeps going. Selling because "RSI is overbought" is how people fight trends and lose. Our own hourly readings use RSI 14 as one vote among several for exactly that reason — it is never allowed to decide on its own.
What it measures
The "relative" in the name is not relative to another asset. It is the ratio of average gains to average losses in the same price series over the last n closes. J. Welles Wilder introduced it in 1978 with n = 14, and 14 is still the default on every platform including MetaTrader 5 — not because it is optimal, but because it is the convention everyone else is looking at.
A shorter length reacts faster and crosses 70 and 30 constantly. A longer length is steadier and later. There is no setting that is both.
The formula, in words
For each period, take the close-to-close change. Positive changes are gains, negative ones are losses (as positive numbers). Average the first 14 of each. From then on, Wilder's smoothing updates each average as ((n − 1) × previous average + today's value) ÷ n. Relative strength, RS, is average gain ÷ average loss, and
RSI = 100 − 100 ÷ (1 + RS)
Wilder's smoothing matters. A platform that uses a plain moving average of gains and losses draws a visibly different line, and two traders arguing about "the RSI" may be looking at two different indicators.
Worked example
Suppose the smoothed average gain is 0.80 and the smoothed average loss is 0.40. RS = 0.80 ÷ 0.40 = 2. RSI = 100 − 100 ÷ 3 = 66.67.
That number says recent average gains have been twice recent average losses. It does not say the next candle is more likely to be red. If tomorrow gains 1.20, the average gain becomes (13 × 0.80 + 1.20) ÷ 14 = 0.829, the average loss becomes (13 × 0.40 + 0) ÷ 14 = 0.371, RS = 2.23 and RSI = 69.1. Notice how slowly it moves: thirteen-fourteenths of yesterday's average survives into today.
How it is read
Fifty is the midpoint: above it, gains have been outrunning losses; below it, the reverse. Some traders watch whether RSI holds a higher floor in an uptrend (say, bouncing off 40 rather than 30) as a sign the trend is intact.
Divergence is the other common reading: price makes a higher high, RSI makes a lower high, so the new high came with less momentum than the last one. That is a reason to look more closely. It is not a signal to sell, because divergences can persist through an entire further leg up.
RSI is at its most useful in a market that is rotating in a range, where 70 and 30 do roughly mark the turns. It is at its least useful in the one-way move everybody wants to catch.
When it lies
Four ways. Overbought is read as overpriced — but a market can be strong rather than due to fall. Oversold is read as cheap — a falling market can stay below 30 much longer than your margin lasts. A divergence is read as timing when it only shows a difference. And a short look-back on noisy data produces crosses that vanish when the candle closes.
It is also distorted by anything that distorts the close series: a gap, one enormous candle, a thin session, an unadjusted corporate action. Two data feeds with different session boundaries give two RSI values, and neither is wrong.
What it does not tell you
Fair value. Why the market moved. How far the next move goes or how long the trend lasts. Volume, liquidity, event risk. And nothing about whether the position you are about to take is the right size — that comes from the stop distance and the account, not from an oscillator.
What the evidence actually says
Three papers come up in every serious discussion of indicators, so it is worth knowing what they found rather than what people say they found. Brock, Lakonishok and LeBaron (1992) tested simple moving-average and trading-range rules on ninety years of the Dow and found they carried information relative to a random benchmark. Sullivan, Timmermann and White (1999) then re-ran that idea across nearly eight thousand rule variants and showed that once you account for how many rules were tried, the best-looking one is far less impressive — the "data-snooping" result. Park and Irwin (2007) reviewed ninety-five later studies and found roughly half positive, a quarter negative and the rest mixed, with results weakening after transaction costs and risk adjustment.
The fair summary is neither that indicators work nor that they are worthless. It is that a fully specified rule — entry, exit, size, costs — can be tested, and most rules that look good on a chart do not survive the test. Whatever you build on this indicator, test it as a complete rule on data it has not seen.
Chong and Ng (2008) tested RSI and MACD rules specifically, on the London FT30, and found some specifications did carry information in that sample. That is evidence about those rules on that index in those years — not a licence to trade every market on RSI 14.
Where to see it live
Every instrument page under Technical signals shows the current RSI 14 on the hourly chart, alongside MACD, three moving averages and the stochastic, and says which way each one is voting and why. Reading the guide and then the live number is the fastest way to see how often "overbought" and "still rising" coincide.
A note on risk: an indicator built from past prices cannot contain information the price does not already contain. Size the position for the stop, not for the confidence the indicator gives you.
Sources
- Wilder, J. Welles, New Concepts in Technical Trading Systems (1978): Internet Archive
- Chong, T. T.-L. and Ng, W.-K. (2008), "Technical analysis and the London stock exchange: testing the MACD and RSI rules using the FT30": DOI
- Brock, Lakonishok and LeBaron (1992), "Simple Technical Trading Rules and the Stochastic Properties of Stock Returns": DOI
- Sullivan, Timmermann and White (1999), "Data-Snooping, Technical Trading Rule Performance, and the Bootstrap": DOI
- Park and Irwin (2007), "What Do We Know About the Profitability of Technical Analysis?": DOI
- Lo, Mamaysky and Wang (2000), "Foundations of Technical Analysis": DOI
Written by the Ultimo Research Desk and checked against our own contract specifications and client agreement before publication; reviewed again when those change. Educational only — nothing here is a recommendation to trade. Spotted an error? Tell us.