7 minute read · Ultimo Research Desk · Reviewed 5 Sept 2026
Commodity Channel Index: What It Measures and When It Lies
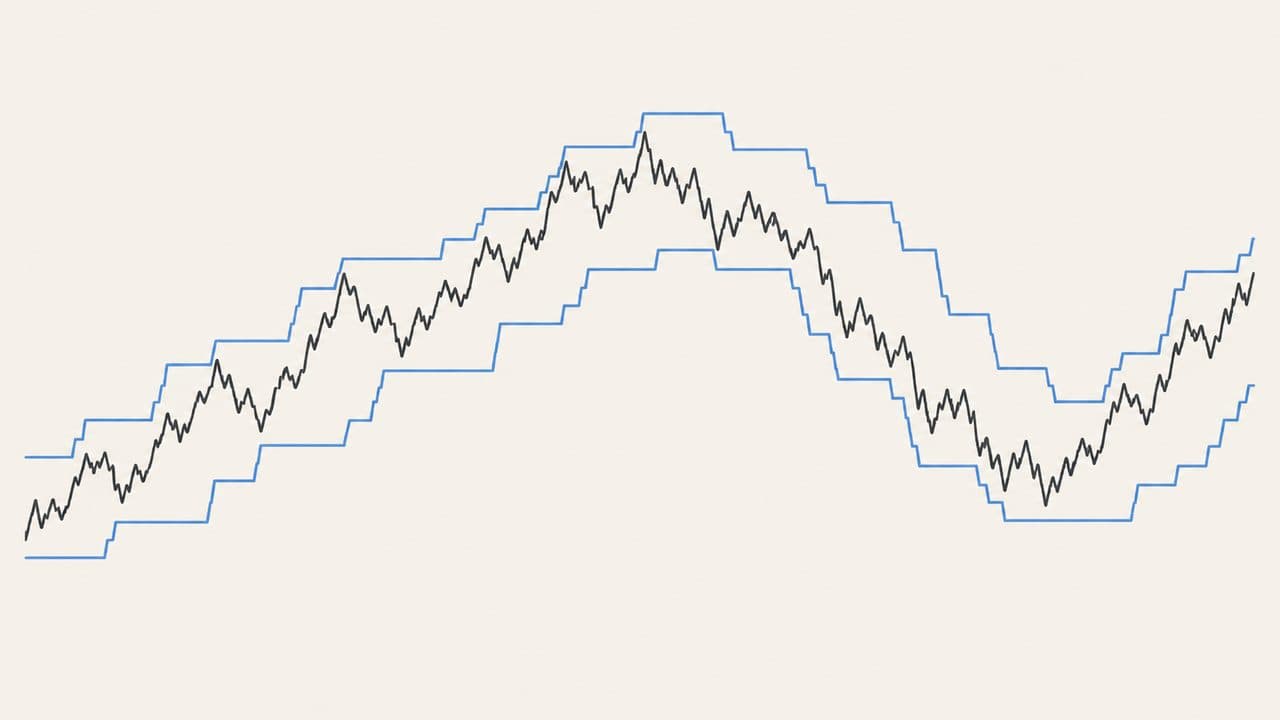
CCI measures how far today's typical price — the average of high, low and close — sits from its own 20-bar average, divided by how far it has typically sat from that average. It is a standardised distance from the mean, like a z-score with a rougher denominator, scaled by a constant so that around three quarters of readings land between −100 and +100. Above +100 the price is unusually far above its average; below −100, unusually far below.
It lies the way every unbounded oscillator lies: "unusually far above the average" is what the first weeks of a trend look like, and CCI sits above +100 for as long as the trend accelerates. It also lies through its denominator, which is a 20-bar average of deviations — when a calm period has shrunk it, an ordinary move produces a dramatic reading.
What it measures
Donald Lambert published CCI in 1980 for commodity cycles, and the name has misled people since: nothing in the arithmetic is specific to commodities, and it is used on everything. Twenty periods is the convention; Lambert's own advice was to use roughly a third of the cycle length you believe you are looking at, which is honest about the fact that the setting is a guess.
The 0.015 constant is not mysterious. Lambert chose it so that, on the data he used, about 70–80% of readings fell inside ±100. It is a scaling convenience, not a statistical property, and the "±100" zones inherit that: they describe how far a price usually strays, not a boundary it respects.
The formula, in words
- Typical price = (high + low + close) ÷ 3.
- SMA = 20-period simple average of typical price.
- Mean deviation = the average of |typical price − SMA| over the same 20 bars, using each bar's distance from today's SMA (not a rolling standard deviation — absolute distances, not squared).
- CCI = (typical price − SMA) ÷ (0.015 × mean deviation)
Some platforms compute step 3 against each bar's own SMA rather than today's; the difference is small but real.
Worked example
Use five bars to keep it short. Typical prices: 100, 101, 103, 102, 104. SMA = 510 ÷ 5 = 102.
Distances from 102: 2, 1, 1, 0, 2. Mean deviation = 6 ÷ 5 = 1.2.
Today's typical price is 104, so CCI = (104 − 102) ÷ (0.015 × 1.2) = 2 ÷ 0.018 = 111.1. Two points above a five-bar average, in a series that usually strays by about one, reads as "unusually high". Now let the next bar's typical price be 104 again: the window drops the 100, the SMA becomes 102.8, the distances are 1.8, 0.2, 0.8, 1.2, 1.2, mean 1.04, and CCI = 1.2 ÷ 0.0156 = 76.9. Price did not move; CCI fell by a third because the average caught up.
How it is read
Above +100: unusually strong relative to the recent average; below −100: unusually weak. Lambert's original rule was to buy when CCI rose through +100 and sell when it fell back through it — a trend-following use — and the popular modern reading is the reverse, fading +100 as "overbought". The same line supports both, which tells you what the line knows about direction. The zero cross is the typical price passing its average, a slow moving-average cross in disguise. Divergence carries the usual caveats.
When it lies
Trend persistence above +100. A shrunken denominator after a quiet stretch, producing ±200 readings on modest moves. A gap that drags the typical price and the mean deviation at once. Thin sessions that produce wide highs and lows and distort the typical price. A period fitted to a cycle you decided existed after looking at the chart.
What it does not tell you
Direction of the next move, fair value, cause, volume, or how long "unusual" lasts. Whether +150 is a breakout or an exhaustion — the two are the same number.
What the evidence actually says
The same three papers apply to every indicator in this series, so the short version: Brock, Lakonishok and LeBaron (1992) found simple moving-average and trading-range rules carried information on ninety years of the Dow; Sullivan, Timmermann and White (1999) showed that once you count how many rules were tried, the best of them stops being significant — the data-snooping result; Park and Irwin (2007) reviewed ninety-five later studies and found roughly half positive, a quarter negative, and most of the positives shrinking after costs. The RSI guide has the longer version.
No peer-reviewed study tests CCI specifically. Lambert's own article is a description of the construction with examples, not an evaluation.
Where it fits
Not a vote on our signal pages: it duplicates what RSI and Bollinger Bands already say — distance from an average, in units of recent deviation — with a scaling constant that has no statistical meaning. If you like the idea, the Bollinger "%B" reading is the same measurement with a cleaner denominator.
A note on risk: an unbounded oscillator has no top. +100 is where the price usually stops straying, not where it must.
Sources
- Lambert, Donald R., "Commodity Channel Index: Tool for Trading Cyclic Trends", Commodities magazine (October 1980); reprinted in Technical Analysis of Stocks & Commodities (1983)
- Brock, Lakonishok and LeBaron (1992): DOI
- Sullivan, Timmermann and White (1999): DOI
- Lo, Mamaysky and Wang (2000): DOI
- Park and Irwin (2007): DOI
- Murphy, John J., Technical Analysis of the Financial Markets (1999): Google Books
Written by the Ultimo Research Desk and checked against our own contract specifications and client agreement before publication; reviewed again when those change. Educational only — nothing here is a recommendation to trade. Spotted an error? Tell us.