7 minute read · Ultimo Research Desk · Reviewed 5 Sept 2026
Heikin-Ashi Candles: What They Measure and When They Lie
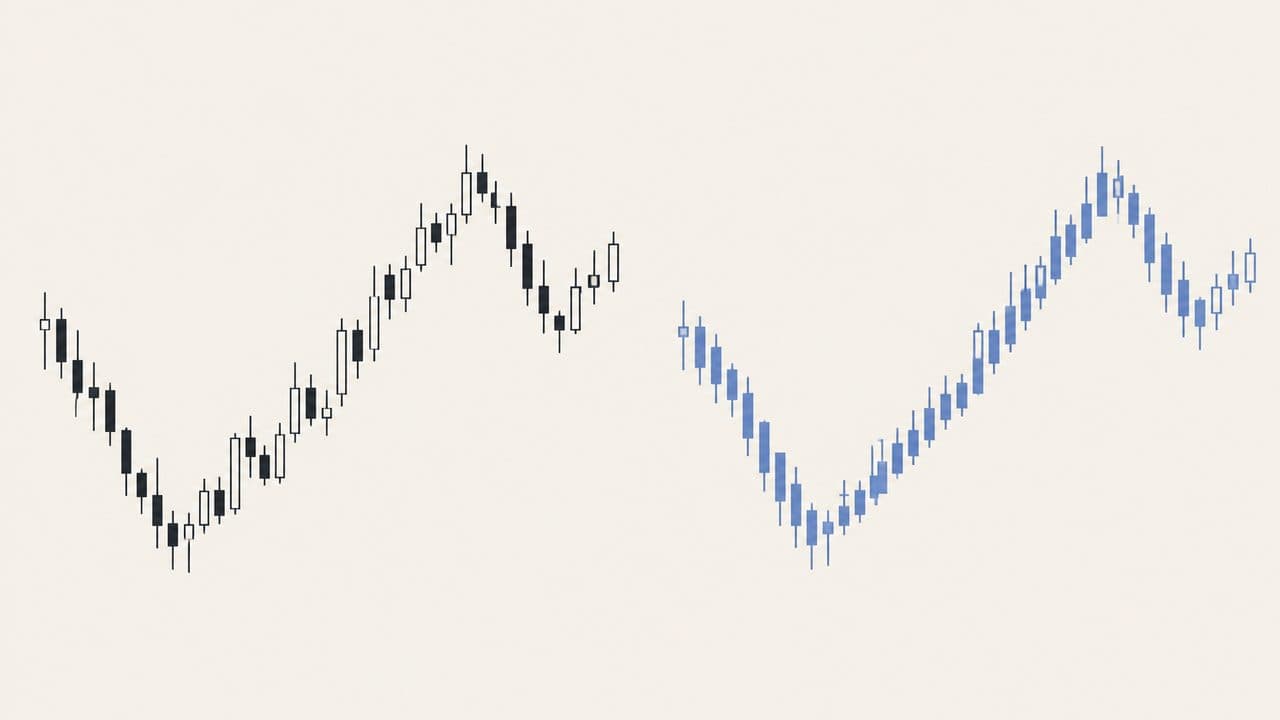
Heikin-Ashi candles are not prices. Each one is built from averages: the close is the average of the bar's four prices, the open is the midpoint of the previous synthetic candle, and the high and low are whichever is most extreme among the real high, the real low and those two averages. The result is a chart that looks like candlesticks and behaves like a moving average — long runs of one colour in a trend, small wicks, a calm surface over a noisy market.
They lie in the most literal way an indicator can: the numbers on the screen are not numbers anyone traded at. A Heikin-Ashi open can be a price the market never touched that bar. A stop placed "under the last candle" is placed under a calculation. And because the open is recursive, the candles keep pointing the old way for several bars after price has turned.
What they measure
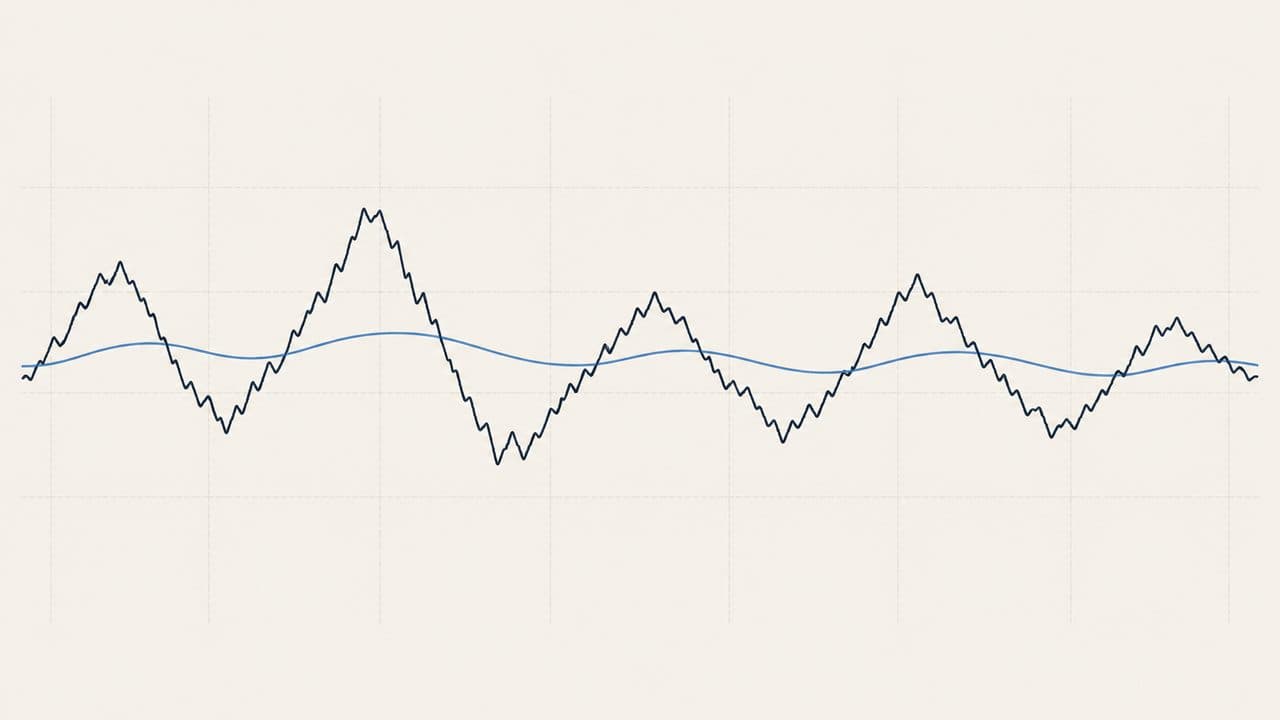
Heikin is average, ashi is bar. The construction is a Japanese charting convention with no securely documented inventor; Dan Valcu's 2004 article introduced it to most English-speaking readers. There is no period setting because the smoothing comes from the recursion itself — each open carries half of the previous candle forward, and that candle carried half of the one before, so the memory fades geometrically like an EMA with α = 0.5.
The first candle needs a seed, usually the ordinary open-close midpoint, so a chart's earliest Heikin-Ashi bars differ by platform and by how much history was loaded.
The formula, in words
- HA close = (open + high + low + close) ÷ 4, from the ordinary bar.
- HA open = (previous HA open + previous HA close) ÷ 2.
- HA high = the largest of the ordinary high, HA open, HA close.
- HA low = the smallest of the ordinary low, HA open, HA close.
Only step 1 uses today's prices in full; step 2 uses none of them.
Worked example
Ordinary bar: open 100, high 106, low 98, close 104. Previous HA open 99, previous HA close 101.
HA close = 408 ÷ 4 = 102. HA open = 200 ÷ 2 = 100. HA high = max(106, 100, 102) = 106. HA low = min(98, 100, 102) = 98.
So the market opened at 100 and closed at 104 — a four-point up bar — and the Heikin-Ashi candle shows 100 to 102, a two-point up bar. Now let the next ordinary bar reverse: open 104, high 105, low 99, close 100. HA close = 408 ÷ 4 = 102. HA open = (100 + 102) ÷ 2 = 101. The real bar fell four points; the Heikin-Ashi candle is still green, 101 to 102. That is the lag, and it is one bar in this example only because the reversal was sharp.
How they are read
A run of same-coloured candles with no lower wicks is read as a clean uptrend; the recursion is doing what it does. A change of colour is read as a possible turn; it is the averages catching up. Small bodies with wicks both sides are read as indecision; they are the averages meeting the price. Comparing the two charts side by side is the most honest use: it shows how much the smoothing hides.
When they lie
Lag, by construction. Hidden gaps: the synthetic open bridges a gap the market jumped. Hidden reversals inside the bar. Wicks that are not prices. Seed differences between platforms. And the trap the guide exists to name: any stop, target or backtest fill taken from a Heikin-Ashi level is taken from a price that may not have existed.
What they do not tell you
Where the market actually opened or closed, how much intrabar risk there was, why the move happened, or when it will end. Nothing about volume or value.
What the evidence actually says
The same three papers apply to every indicator in this series, so the short version: Brock, Lakonishok and LeBaron (1992) found simple moving-average and trading-range rules carried information on ninety years of the Dow; Sullivan, Timmermann and White (1999) showed that once you count how many rules were tried, the best of them stops being significant — the data-snooping result; Park and Irwin (2007) reviewed ninety-five later studies and found roughly half positive, a quarter negative, and most of the positives shrinking after costs. The RSI guide has the longer version.
No study tests Heikin-Ashi and none is likely to: it is a display transform, and any rule built on it is a rule on a moving average of a moving average, which the literature has covered.
Where they fit
Not a vote on our signal pages, which are computed from real closes on purpose. On MT5, if you use Heikin-Ashi, keep an ordinary chart open beside it and take every level from the ordinary one. The moving averages guide explains the EMA these candles secretly are.
A note on risk: a candle that looks like a price but is not one is easy to misuse. Take every level from the ordinary chart.
Sources
- Valcu, Dan, "Using the Heikin-Ashi Technique", Technical Analysis of Stocks & Commodities, February 2004 — the first widely read English description; the earlier Japanese origin is not securely documented.
- Brock, Lakonishok and LeBaron (1992): DOI
- Sullivan, Timmermann and White (1999): DOI
- Lo, Mamaysky and Wang (2000): DOI
- Park and Irwin (2007): DOI
- Menkhoff and Taylor (2007): DOI
- Murphy, John J., Technical Analysis of the Financial Markets (1999): Google Books
Written by the Ultimo Research Desk and checked against our own contract specifications and client agreement before publication; reviewed again when those change. Educational only — nothing here is a recommendation to trade. Spotted an error? Tell us.