7 minute read · Ultimo Research Desk · Reviewed 5 Sept 2026
Donchian Channels: What They Measure and When They Lie
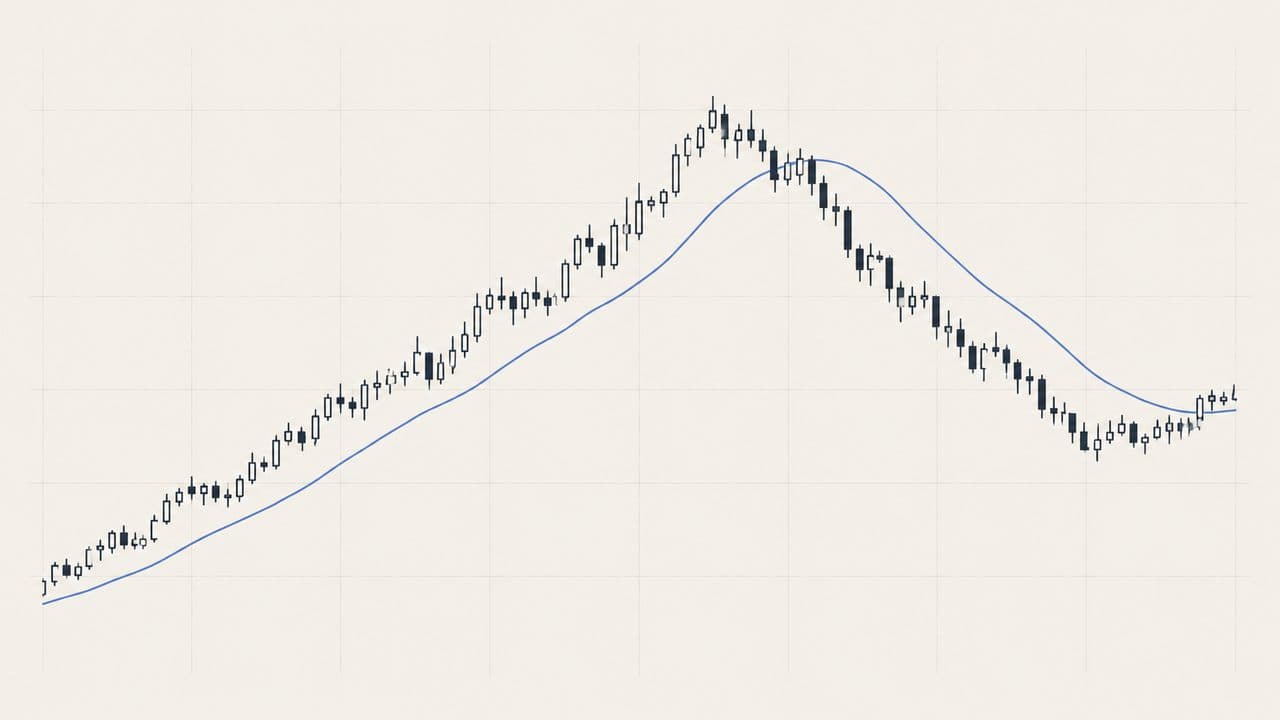
Donchian Channels are the simplest envelope on any chart: the upper line is the highest high of the last 20 bars, the lower line the lowest low, and the middle line halfway between. No averaging, no smoothing, no constants. A "breakout" is price making a new 20-bar high or low, and the famous trend-following systems of the 1980s were built on exactly that.
They lie in a range and they lie by stepping. A spike one tick above the old high is a breakout by definition and reverses inside the range a bar later. And because the lines are extremes, they do not glide: the upper line drops the day the old high leaves the window, on a day price did nothing, and a chart reader sees a "narrowing channel" that is pure bookkeeping.
What they measure
Richard Donchian ran a managed-futures fund from 1949 and published trend-following guidelines from the 1930s; the four-week rule — buy a new four-week high, sell a new four-week low — is the ancestor of the channel. Twenty bars is the four-week rule on a daily chart. Fifty-five, from the later Turtle rules, is the other common setting. Neither is optimal; both are watched.
The channel width is the recent range, not volatility in the ATR or standard-deviation sense: one outlier bar sets it for twenty bars. A narrow channel says the last twenty bars stayed in a band; it does not say what happens when they stop.
The formula, in words
- Upper = the largest high in the last n bars.
- Lower = the smallest low in the last n bars.
- Middle = (upper + lower) ÷ 2 — a range midpoint, not an average of closes.
One decision matters: whether today's bar is inside the window. For drawing the channel, it usually is. For asking "did today break out?", the reference is the previous n bars, otherwise today's high is always equal to the upper line and nothing ever breaks out. Backtests get this wrong constantly.
Worked example
Four-bar window. Highs 101, 103, 102, 105; lows 99, 100, 98, 101. Upper 105, lower 98, middle 101.5.
Next bar: high 106, low 103. Against the previous window it is a breakout (106 > 105). The new window drops the first bar (101/99) and reads highs 103, 102, 105, 106 and lows 100, 98, 101, 103: upper 106, lower still 98. Two bars later the 98 leaves the window and the lower line jumps up to whatever the next-lowest low is — at least 101 — with no help from price. That jump is the step the chart shows.
How they are read
Price at the upper line: a new n-bar high. At the lower: a new n-bar low. The trend-following reading is to go with the break and exit on the opposite (or a shorter) channel. The middle line is a crude trend reference. Width is the recent range.
What makes Donchian breaks different from most signals is that they are watched by systems with real money: a 20-day high in a liquid futures market is a level where mechanical buying arrives. That does not make the break predictive; it makes it crowded, which is a different and more useful thing to know.
When they lie
In a range, every spike is a break and every break fails. One bad tick or a thin-session wick sets a line for twenty bars. Gaps open beyond the channel and leave it meaningless for the day. The step when an extreme leaves the window. Fitting n to last year. And the inclusion error in backtests.
What they do not tell you
Whether the new extreme is information or noise, how long it lasts, liquidity at the level, or value. Nothing about how prices were distributed inside the channel.
What the evidence actually says
The same three papers apply to every indicator in this series, so the short version: Brock, Lakonishok and LeBaron (1992) found simple moving-average and trading-range rules carried information on ninety years of the Dow; Sullivan, Timmermann and White (1999) showed that once you count how many rules were tried, the best of them stops being significant — the data-snooping result; Park and Irwin (2007) reviewed ninety-five later studies and found roughly half positive, a quarter negative, and most of the positives shrinking after costs. The RSI guide has the longer version.
Brock, Lakonishok and LeBaron's "trading-range break" rule is a Donchian channel by another name — buy when price exceeds the recent maximum — and it is the rule that showed information on the Dow through 1986. Sullivan, Timmermann and White's re-test is the reason not to stop reading there.
Where they fit
Not a vote on our signal pages; the pivot levels there answer the "where are the recent extremes" question for one day rather than twenty. For the sizing that trend-following systems paired with these channels, the ATR guide is the other half; for why the channel is not volatility, the Keltner guide.
A note on risk: the line is a place price has already been. The stop belongs where the break is proven wrong, and that is usually inside the channel, not at its edge.
Sources
- Donchian, Richard, "Donchian's Trading Guidelines" (first published 1934), reproduced with history at StockCharts ChartSchool
- Brock, Lakonishok and LeBaron (1992): DOI
- Sullivan, Timmermann and White (1999): DOI
- Lo, Mamaysky and Wang (2000): DOI
- Park and Irwin (2007): DOI
- Menkhoff and Taylor (2007): DOI
- Murphy, John J., Technical Analysis of the Financial Markets (1999): Google Books
Written by the Ultimo Research Desk and checked against our own contract specifications and client agreement before publication; reviewed again when those change. Educational only — nothing here is a recommendation to trade. Spotted an error? Tell us.