7 minute read · Ultimo Research Desk · Reviewed 5 Sept 2026
Keltner Channels: What They Measure and When They Lie
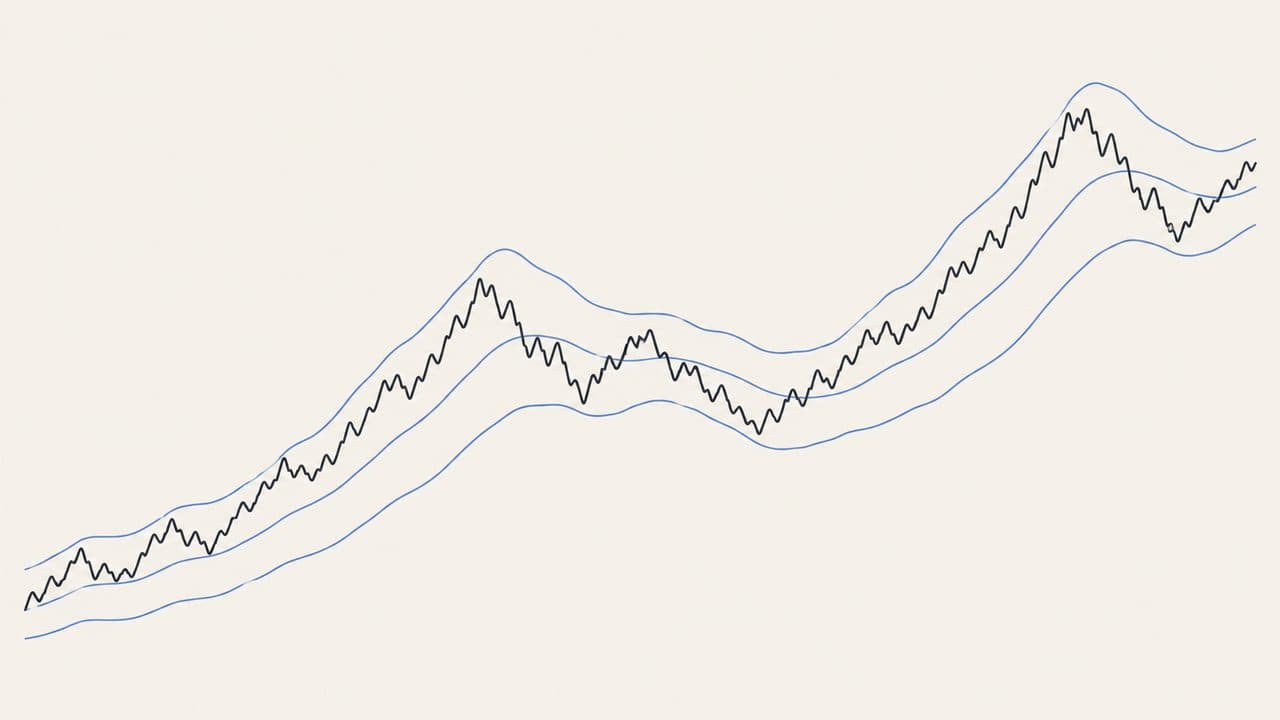
Keltner Channels are a moving average with a band a fixed number of ATRs above it and the same distance below. They answer the same question as Bollinger Bands — how far is price from its average, in units of recent volatility? — with a different ruler: average true range instead of standard deviation. Because ATR moves more smoothly than standard deviation, the channels are smoother and widen less violently after a shock.
They lie the same way the bands do. A price at the upper channel is high relative to a moving average by a volatility allowance. It is not at a ceiling. In a trend price rides the channel; in a range it bounces between channels that keep narrowing around the noise.
What they measure
There are two indicators with this name. Chester Keltner's 1960 version used a ten-day simple average of typical price as the centre and a ten-day average of the daily high–low range for the width. The version on every platform today is later: a 20-period EMA in the centre and 2 × ATR either side, with ATR usually over 10 or 20 periods. The modern form is the one MetaTrader templates mean by "Keltner"; the original is a historical curiosity. Know which one you are looking at before comparing charts.
The centre line is a smoothed price. The width is recent true range, gaps included. Neither is a confidence interval; two ATRs is not "95% of prices".
The formula, in words
Modern form:
- Centre = n-period EMA of the close (α = 2 ÷ (n + 1)).
- ATR = average of true range over m periods — Wilder's smoothing on most platforms, a plain average on some. The ATR guide has the arithmetic.
- Upper = centre + k × ATR. Lower = centre − k × ATR.
Classic form: centre = 10-period SMA of (high + low + close) ÷ 3; upper and lower = centre ± 10-period SMA of (high − low).
Worked example
Centre EMA 102, ATR 1.5, k = 2. Distance 3. Upper 105, lower 99.
One EMA step, to see the centre move: period 20, α = 2 ÷ 21 = 0.0952. Previous EMA 101, close 104: 0.0952 × 10⁴ + 0.9048 × 101 = 9.905 + 91.381 = 101.29. The close was three points above the average and moved it by a quarter of a point. That is what a 20-period centre does — and why price can sit outside the channel for a while before the channel catches up.
How they are read
Price near the upper channel: high relative to the centre by the volatility allowance. Near the lower: the reverse. Outside the channel: further than k ATRs from a lagging average, which in a trend is normal and in a range is rare. Widening channels: recent true ranges are bigger. Narrowing: smaller. A common combination is the "squeeze": Bollinger Bands inside the Keltner Channels, meaning standard deviation has fallen below ATR × k, read as compression before a move. It is a real observation about two volatility measures; it says nothing about direction.
When they lie
In a persistent move price hugs or exceeds one channel while the EMA and ATR catch up, and the channel is read as a ceiling it never was. In a range small ATR changes pump the width in and out around noise. A gap inflates ATR and widens both channels for the whole smoothing window after calm returns. Different ATR smoothing, price source and multiplier produce different channels under one name. Fitting n, m and k to last year's chart tidies last year's chart.
What they do not tell you
Direction, duration, whether the centre is fair value, or whether a width change is information, illiquidity or a bad tick.
What the evidence actually says
The same three papers apply to every indicator in this series, so the short version: Brock, Lakonishok and LeBaron (1992) found simple moving-average and trading-range rules carried information on ninety years of the Dow; Sullivan, Timmermann and White (1999) showed that once you count how many rules were tried, the best of them stops being significant — the data-snooping result; Park and Irwin (2007) reviewed ninety-five later studies and found roughly half positive, a quarter negative, and most of the positives shrinking after costs. The RSI guide has the longer version.
Nobody has tested the modern Keltner Channel in peer-reviewed work; the Bollinger result from Lento, Gradojevic and Wright (2007) — band rules did not beat buy-and-hold after costs — is the nearest evidence and it is not encouraging.
Where they fit
Not a vote on our signal pages, for the same reason as Bollinger: a channel touch is a location, not a direction. If you want one volatility envelope on an MT5 chart, Keltner is the calmer of the two; if you want a stop distance, skip the envelope and use ATR directly.
A note on risk: the channel moves with price and with volatility. Whatever level it showed when you entered, it will show a different one when you need it.
Sources
- Keltner, Chester W., How to Make Money in Commodities (1960): Google Books
- Wilder, J. Welles, New Concepts in Technical Trading Systems (1978): Internet Archive
- Lento, Gradojevic and Wright (2007), "Investment information content in Bollinger Bands?": DOI
- Brock, Lakonishok and LeBaron (1992): DOI
- Sullivan, Timmermann and White (1999): DOI
- Park and Irwin (2007): DOI
- Murphy, John J., Technical Analysis of the Financial Markets (1999): Google Books
Written by the Ultimo Research Desk and checked against our own contract specifications and client agreement before publication; reviewed again when those change. Educational only — nothing here is a recommendation to trade. Spotted an error? Tell us.