9 minute read · Ultimo Research Desk · Reviewed 5 Sept 2026
ADX and the Directional Movement Index: What They Measure and When They Lie
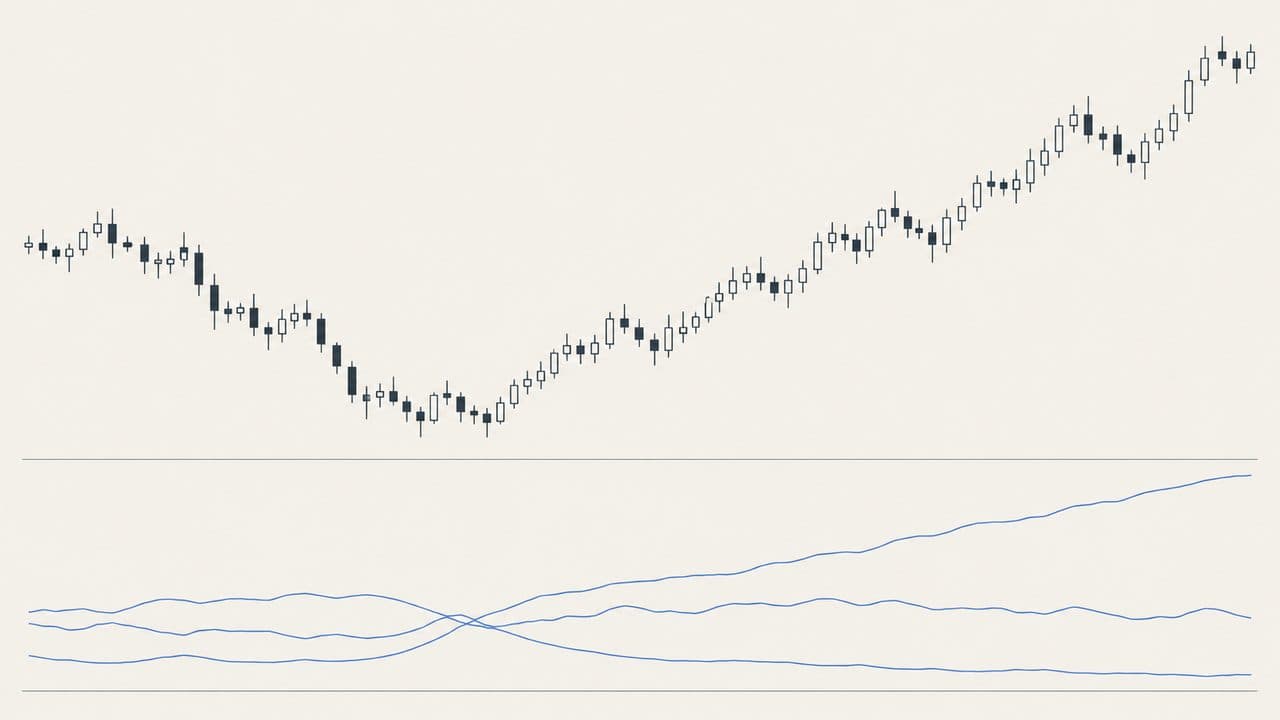
ADX answers one question and refuses to answer another. It says how one-sided recent movement has been — how much of the last fourteen bars' range went in one direction rather than being given back — on a scale from 0 to 100. It does not say which direction. That is the job of its two companions, +DI and −DI, and a chart that shows ADX without them is showing half an indicator.
It lies by arriving late. ADX is smoothed twice, so by the time it climbs through the conventional 25 the move it is describing is plainly visible on the chart, and it can stay high for a dozen bars after the market has gone sideways because the old directional bars are still inside the window. It is a good description of the recent past and a poor timer of anything.
What they measure
Wilder published the Directional Movement system in 1978 alongside RSI, ATR and Parabolic SAR, and designed the four to be used together: ADX to decide whether there is a trend worth following, DI to say which way, SAR to trail it, ATR to size it. The pieces make more sense as a set.
+DI is the smoothed share of true range that was upward directional movement; −DI the downward share. ADX is a smoothed measure of how far apart the two are. All three use fourteen periods by convention, and all three use Wilder's smoothing — the same recursion as RSI and ATR, which is not the usual EMA and gives a visibly slower line.
The formula, in words
For each bar:
- True range: the largest of high − low, |high − previous close|, |low − previous close|.
- Up move = high − previous high. Down move = previous low − low. If the up move is positive and larger than the down move, +DM = up move, else 0. If the down move is positive and larger, −DM = down move, else 0. A bar can contribute to one side or neither, never both.
- Smooth TR, +DM and −DM with Wilder's method: the first value is a 14-bar sum, and each later value is previous − previous ÷ 14 + today's raw.
- +DI = 100 × smoothed +DM ÷ smoothed TR; −DI likewise.
- DX = 100 × |+DI − −DI| ÷ (+DI + −DI).
- ADX = 14-bar average of DX to start, then Wilder-smoothed: (13 × previous ADX + today's DX) ÷ 14.
That is six steps and two rounds of smoothing. It is why ADX is the slowest line on most charts.
Worked example
Today: high 104, low 99. Yesterday: high 102, low 98, close 100.
Up move 104 − 102 = 2. Down move 98 − 99 = −1, not positive, so −DM = 0. +DM = 2. True range = max(5, 4, 1) = 5. Today was an up bar that contributed two fifths of its range to +DM.
Now suppose the smoothed 14-bar values stand at TR 20, +DM 8, −DM 4. +DI = 100 × 8 ÷ 20 = 40. −DI = 100 × 4 ÷ 20 = 20. DX = 100 × 20 ÷ 60 = 33.3. If yesterday's ADX was 28, today's is (13 × 28 + 33.3) ÷ 14 = 397.3 ÷ 14 = 28.4.
Note what the last step did: a bar with a DX of 33 moved ADX from 28.0 to 28.4. ADX would need a run of such bars to reach 30. That is the lag, in numbers.
How they are read
+DI above −DI: recent upward movement has outweighed downward. Below: the reverse. The DI cross is the directional signal, and it whipsaws in a range like any other cross.
ADX rising: the two sides are separating — one direction is winning more clearly, whichever it is. ADX falling: the sides are converging; the market is giving back what it takes. The conventional reading is "below 20–25, no trend; above, trend", and those thresholds are conventions. An ADX of 40 after a crash and an ADX of 40 in a steady climb are the same number.
The most useful reading is the negative one: a low ADX says trend-following tools (moving-average crosses, SAR, Donchian breaks) are operating in the conditions where they fail. That is worth knowing before trusting any of them.
When they lie
Late, as above. Sticky, because a shock stays in the window for fourteen bars and keeps ADX elevated through the calm that follows. A gap inflates TR and dilutes both DI values at once. In a range the DI lines cross repeatedly while ADX drifts, and the crosses mean nothing. Fitting the period to last year's chart, and any backtest that uses a bar's final high before the bar closed.
What they do not tell you
Why price moved, how far it will go, whether the level is reasonable, or how much a position would risk. Direction, in ADX's case — it will read 40 in a collapse.
What the evidence actually says
The same three papers apply to every indicator in this series, so the short version: Brock, Lakonishok and LeBaron (1992) found simple moving-average and trading-range rules carried information on ninety years of the Dow; Sullivan, Timmermann and White (1999) showed that once you count how many rules were tried, the best of them stops being significant — the data-snooping result; Park and Irwin (2007) reviewed ninety-five later studies and found roughly half positive, a quarter negative, and most of the positives shrinking after costs. The RSI guide has the longer version.
Nothing in the standard literature tests ADX on its own. It is a filter, not a signal, and filters get tested inside the rules they filter.
Where they fit
Not a vote on our signal pages, because ADX has no direction to vote with. It is the natural check on the votes that do: when the moving-average and MACD lines are crossing every few hours, a low ADX is the explanation. Wilder meant it to be read before Parabolic SAR, and that advice has aged well.
A note on risk: a rising ADX says the recent move was one-sided. It says nothing about the next one, which is the one you would be in.
Sources
- Wilder, J. Welles, New Concepts in Technical Trading Systems (1978): Internet Archive
- Brock, Lakonishok and LeBaron (1992): DOI
- Sullivan, Timmermann and White (1999): DOI
- Lo, Mamaysky and Wang (2000): DOI
- Park and Irwin (2007): DOI
- Menkhoff and Taylor (2007): DOI
- Murphy, John J., Technical Analysis of the Financial Markets (1999): Google Books
Written by the Ultimo Research Desk and checked against our own contract specifications and client agreement before publication; reviewed again when those change. Educational only — nothing here is a recommendation to trade. Spotted an error? Tell us.