8 minute read · Ultimo Research Desk · Reviewed 5 Sept 2026
Parabolic SAR: What It Measures and When It Lies
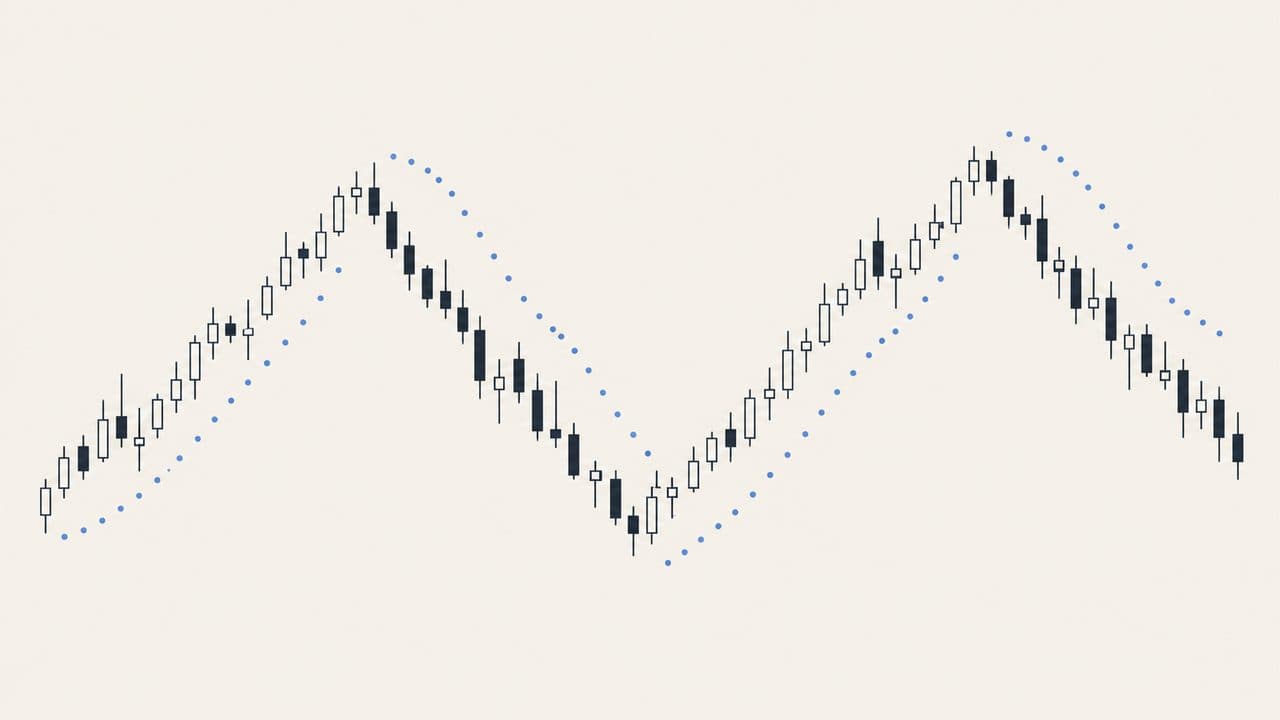
Parabolic SAR draws a dot under the price in an uptrend and over it in a downtrend. Each bar the dot moves closer to price, faster and faster the longer the trend has run — that is the "parabolic" — and when price crosses the dot, the dot flips to the other side. SAR means "stop and reverse": Wilder designed it as a trailing stop that is always in the market, long or short.
It lies in a range. A crossing is, by definition, a reversal, so a market that oscillates in a band flips the dots every few bars, each flip describing the last swing and none of them saying anything about the next. It also lies at a gap, when the dot sits at a level that was never tradable.
What it measures
Wilder published the Parabolic Time/Price System in New Concepts in Technical Trading Systems (1978), alongside RSI and ATR. The idea is that a stop should tighten with time as well as with price: the longer a trend has lasted, the less room it should be given.
Two settings control it. The acceleration factor starts at 0.02 and rises by 0.02 every time the trend makes a new extreme, up to a cap of 0.20. Those numbers are Wilder's defaults, not laws. A smaller step keeps the dot further back; a higher cap lets it catch up faster in a long move. Both change how often the system reverses.
"Stop" is a misleading word here. The dot is a calculation, not an order. It knows nothing about your position, your liquidity or how much you can afford to lose.
The formula, in words
Each bar, in an uptrend:
- Next SAR = current SAR + AF × (EP − current SAR), where EP is the highest high since the uptrend began and AF is the acceleration factor.
- The result may not be above the lowest low of the previous two bars; if it is, it is pulled down to that low.
- If this bar made a new high, EP becomes that high and AF rises by 0.02, up to 0.20. Otherwise both stay.
- If price trades below the SAR, the trend reverses: the new SAR is the old EP, the new EP is this bar's low, AF resets to 0.02, and the whole thing runs mirrored.
A downtrend is the same with highs and lows exchanged. The seed — how the very first SAR is chosen — differs between platforms, so two correct implementations disagree for the first few bars.
Worked example
Uptrend. Current SAR 96, EP 106, AF 0.02.
Next SAR = 96 + 0.02 × (106 − 96) = 96 + 0.20 = 96.20.
The previous two lows were 97 and 98; the SAR may not exceed 97, and 96.20 does not, so it stands. Now suppose the next bar prints a new high of 108. EP becomes 108 and AF becomes 0.04. The bar after that: 96.20 + 0.04 × (108 − 96.20) = 96.20 + 0.472 = 96.672. Same trend, twice the speed. After ten further new highs AF reaches its 0.20 cap and the dot closes a fifth of the remaining gap every bar.
How it is read
Dots below price: the system is long. Dots above: short. A flip is the system reversing. Each of those is a statement about a rule applied to past prices, not about the next bar.
The distance between the dot and price is often read as "how much room the trend has". It is really a function of how many new extremes the trend has made and how fast AF has climbed. A dot hugging price tightly after a long run is not a confidence measure; it is what the arithmetic does after ten new highs.
When it lies
The sideways market is the main failure, and it is structural: the system has no "neutral" state. It is always long or short, and in a range it is always wrong shortly after being right. Wilder said so himself and recommended a trend filter — his own ADX — before trusting a SAR flip.
Gaps put the dot at a price that never traded. A thin market prints a stray high, EP jumps, AF steps up, and the dot accelerates toward a level the market did not really reach. Fitting the step and cap to last year's chart tidies the picture and proves nothing. And a backtest that uses a bar's final high to set a dot, then assumes a fill earlier in that bar, is looking ahead.
What it does not tell you
The size or duration of the move, why a gap happened, whether liquidity exists at the dot, or what a fill there will cost. It measures nothing about value and nothing about volatility except through the price path.
What the evidence actually says
The same three papers apply to every indicator in this series, so the short version: Brock, Lakonishok and LeBaron (1992) found simple moving-average and trading-range rules carried information on ninety years of the Dow; Sullivan, Timmermann and White (1999) showed that once you count how many rules were tried, the best of them stops being significant — the data-snooping result; Park and Irwin (2007) reviewed ninety-five later studies and found roughly half positive, a quarter negative, and most of the positives shrinking after costs. The RSI guide has the longer version.
No paper in the standard literature tests Parabolic SAR on its own. Wilder's book presents it as one component of a rule set, and that is how it should be evaluated: as a complete rule with a filter, an exit and costs.
Where it fits
Not a vote on our signal pages: a rule that must always be long or short would be the loudest voice in the room and the least informative in a range. The natural pairing is ATR, Wilder's other trailing distance, which does not flip and does not pretend to know the direction.
A note on risk: a dot under the price is a place the system would reverse, not a place your order will fill. In a fast market the two are not the same number.
Sources
- Wilder, J. Welles, New Concepts in Technical Trading Systems (1978): Internet Archive
- Brock, Lakonishok and LeBaron (1992): DOI
- Sullivan, Timmermann and White (1999): DOI
- Lo, Mamaysky and Wang (2000): DOI
- Park and Irwin (2007): DOI
- Menkhoff and Taylor (2007): DOI
- Murphy, John J., Technical Analysis of the Financial Markets (1999): Google Books
Written by the Ultimo Research Desk and checked against our own contract specifications and client agreement before publication; reviewed again when those change. Educational only — nothing here is a recommendation to trade. Spotted an error? Tell us.