8 minute read · Ultimo Research Desk · Reviewed 5 Sept 2026
VWAP: What It Measures and When It Lies
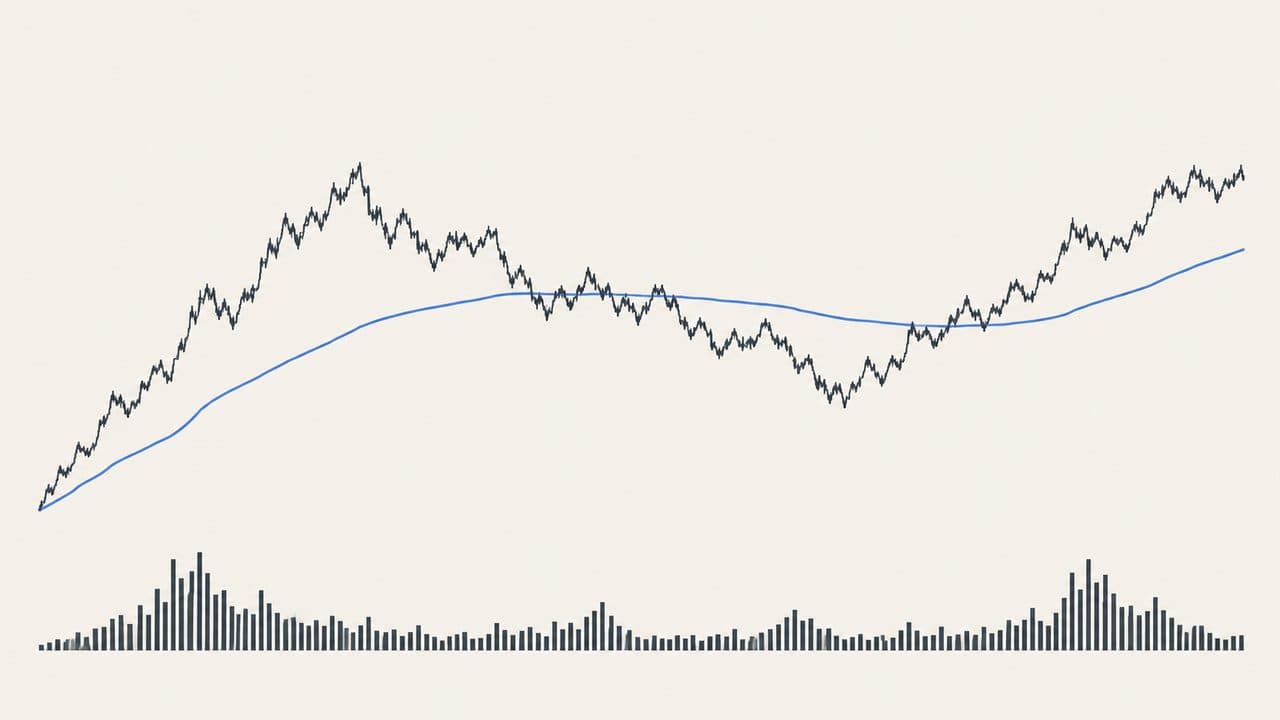
VWAP is the average price at which the instrument actually traded today, with each trade counted in proportion to its size. A big block at 100 counts more than a single lot at 103. Institutions use it as a benchmark — did we buy below the day's average or above it? — and the chart line is that benchmark drawn tick by tick from the session open.
It lies in two ways that matter for a retail chart. First, an MT5 chart does not have trade sizes; it has one volume number per bar, and on forex and most CFDs that number is a tick count, not money. VWAP built from tick counts is a volume-weighted average of something that is not volume. Second, early in the session the line is a handful of trades and swings on every print; late in the session it is so heavy nothing moves it. Same line, two different instruments.
What it measures
VWAP has no inventor. It grew out of transaction-cost analysis on the New York Stock Exchange in the 1980s — Berkowitz, Logue and Noser's 1988 paper is the usual reference — as a way to judge whether a broker's executions were good. On a chart it is normally reset at each session open. "Anchored" VWAP starts from any bar you choose, and the choice of anchor is the entire content of the line.
The exact calculation needs every trade's price and size. A bar chart has open, high, low, close and one volume figure, so platforms approximate with the bar's typical price — (high + low + close) ÷ 3 — times the bar's volume. That assumes every unit traded at one price, which a wide bar refutes.
The formula, in words
- Choose the session (or anchor). Everything before it is excluded.
- For each trade (or bar): price × volume. Add them up — cumulative traded value.
- Add up the volumes — cumulative volume.
- VWAP = cumulative traded value ÷ cumulative volume.
No smoothing of any kind. If cumulative volume is zero the line is undefined.
Worked example
Three groups of trades: 2 units at 100, 1 unit at 101, 2 units at 103.
Traded value: 200 + 101 + 206 = 507. Volume: 5. VWAP = 507 ÷ 5 = 101.40.
The plain average of the three prices is 101.33; VWAP is higher because the 103 trades were bigger. Now the same three prices with volumes 2, 1, 2 read from a forex chart: the "2" is two price updates, not two lots. The arithmetic runs identically and the result means much less.
How it is read
Price above VWAP: the latest price is higher than the session's average paid. Below: lower. An institution working an order reads that as "we are paying up" or "we are getting a good fill". A day trader reads it as trend context, which is a stretch — it is a location relative to a historical average, and crossing it says nothing about the next hour.
The line rising means the average paid is rising, which is what happens when later trades are at higher prices; it does not mean buyers are in control or that the volume is informed.
When it lies
Session choice. A midnight-UTC reset, a New York reset and an exchange-open reset produce three different lines on the same price series. Early-session noise and late-session inertia, as above. Bar approximation hides where inside a wide bar the volume actually traded. Tick-count "volume" on OTC instruments. A single block late in the day that drags the benchmark. And a backtest that compares a morning decision with the end-of-day VWAP is looking ahead.
What it does not tell you
The next price, who traded, the whole market's volume when the feed is one venue, or whether the instrument is worth what it costs.
What the evidence actually says
The same three papers apply to every indicator in this series, so the short version: Brock, Lakonishok and LeBaron (1992) found simple moving-average and trading-range rules carried information on ninety years of the Dow; Sullivan, Timmermann and White (1999) showed that once you count how many rules were tried, the best of them stops being significant — the data-snooping result; Park and Irwin (2007) reviewed ninety-five later studies and found roughly half positive, a quarter negative, and most of the positives shrinking after costs. The RSI guide has the longer version.
VWAP is a benchmark, not a rule, so the rule literature barely mentions it. Berkowitz, Logue and Noser used volume-weighted benchmarks to measure execution cost; nothing in that work says being above or below the line predicts returns.
Where it fits
Not on our signal pages, and deliberately: the hourly data behind them carries tick counts, and a VWAP built on tick counts would be a number with a respectable name and no content. The volume and OBV guide explains what MT5's volume bars actually count. On an exchange-traded instrument with real volume — index futures, a listed share — VWAP is a fine benchmark for your own fills.
A note on risk: a line that looks precise to two decimals can be built on a feed that saw a fraction of the market. Precision is not accuracy.
Sources
- Berkowitz, Logue and Noser (1988), "The Total Cost of Transactions on the NYSE", Journal of Finance 43(1): DOI
- Brock, Lakonishok and LeBaron (1992): DOI
- Sullivan, Timmermann and White (1999): DOI
- Lo, Mamaysky and Wang (2000): DOI
- Park and Irwin (2007): DOI
- Menkhoff and Taylor (2007): DOI
- Murphy, John J., Technical Analysis of the Financial Markets (1999): Google Books
Written by the Ultimo Research Desk and checked against our own contract specifications and client agreement before publication; reviewed again when those change. Educational only — nothing here is a recommendation to trade. Spotted an error? Tell us.