7 minute read · Ultimo Research Desk · Reviewed 5 Sept 2026
Rate of Change and Momentum: What They Measure and When They Lie
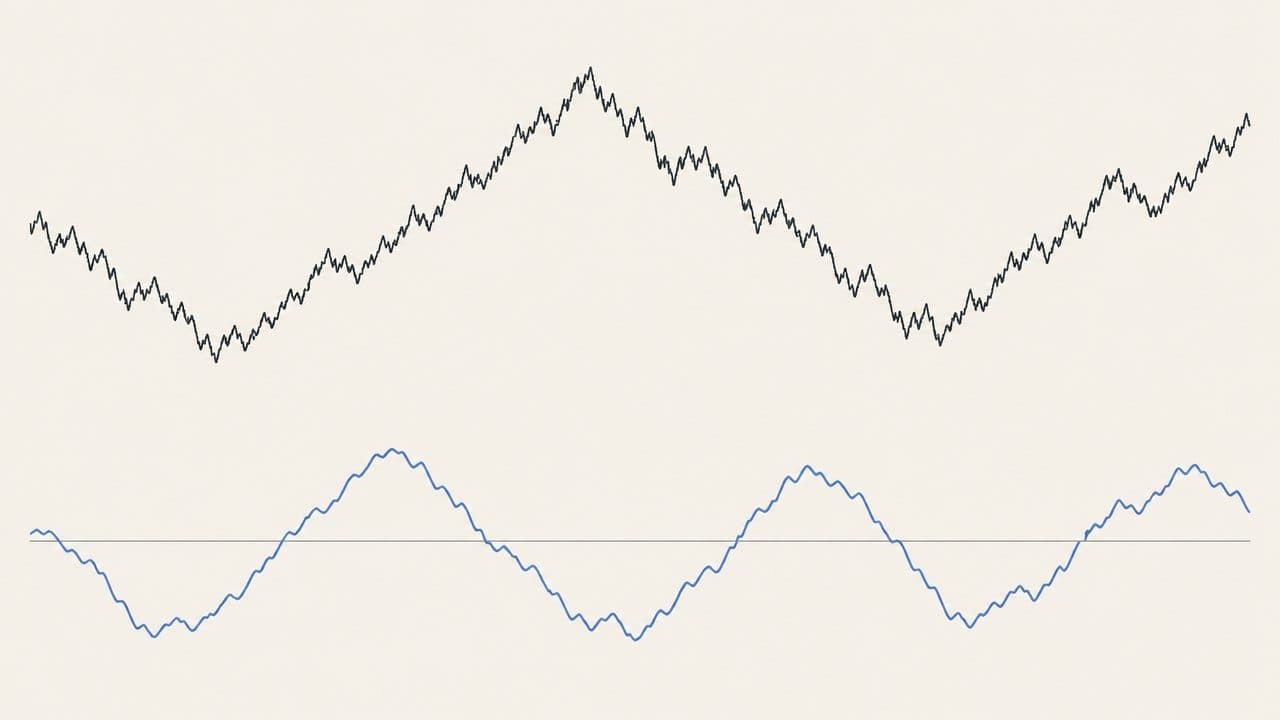
Momentum is the simplest indicator there is: today's close minus the close n bars ago. Rate of Change is the same number as a percentage of the older close. Positive means price is higher than it was; negative means lower. Everything else on the chart — RSI, MACD, the stochastic — is a dressed-up version of this comparison.
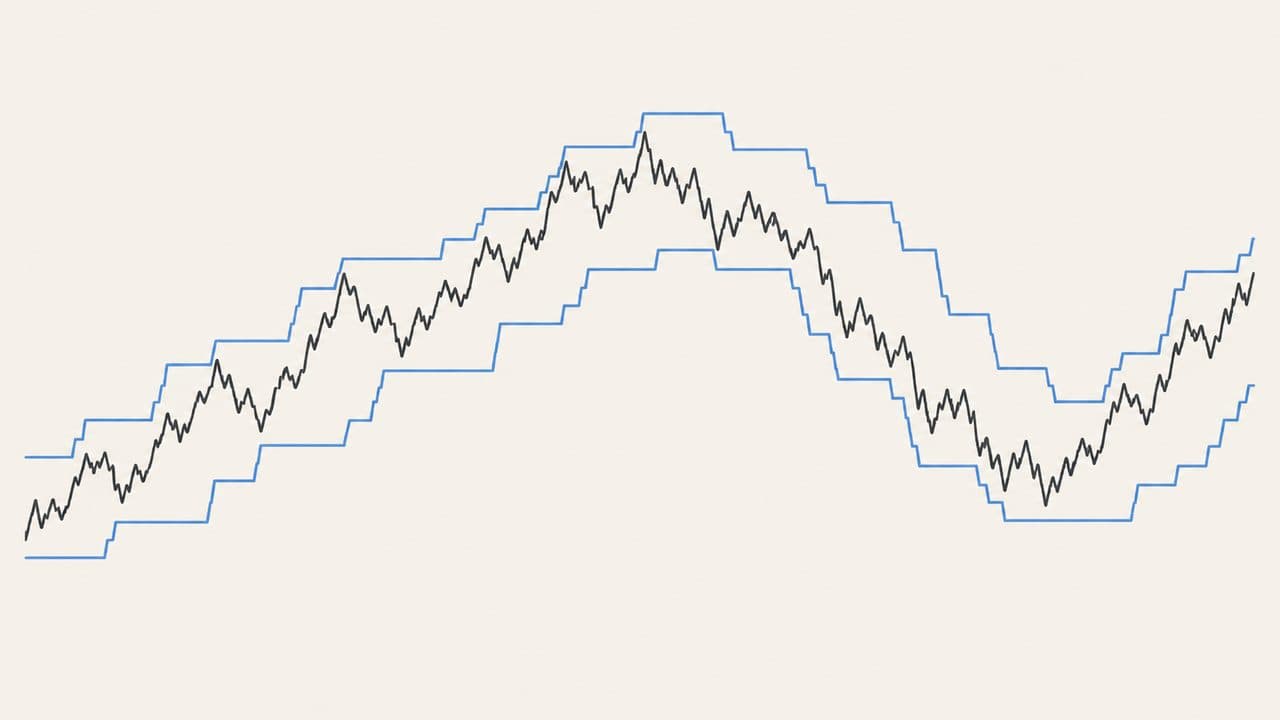
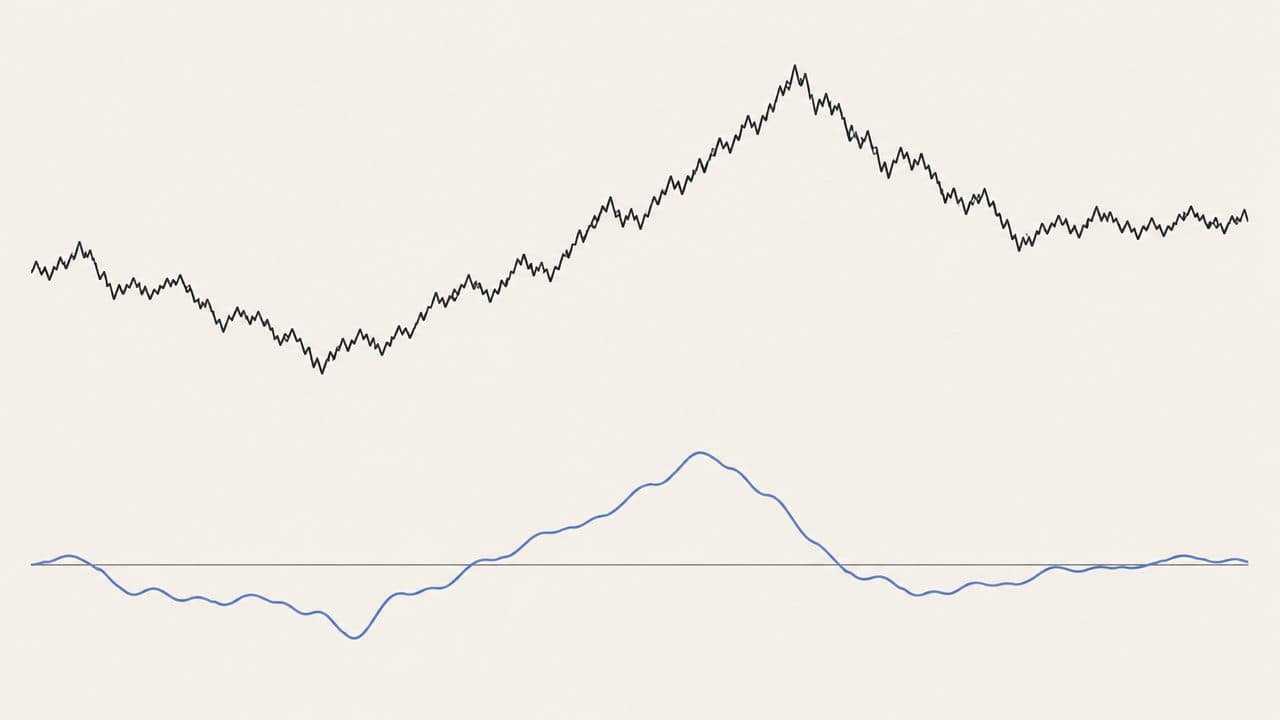
They lie through the window. The reading compares today with one fixed bar in the past, so it can change sharply when that bar drops out of the window and nothing happened today. A big move ten bars ago keeps ROC positive for ten bars after the market has stalled, then flips it negative on a quiet day when the big bar leaves. The indicator is measuring the past bar leaving as much as the current bar arriving.
What they measure
No inventor; the comparison is older than charting. Ten, twelve, fourteen and twenty periods are the common lags, none of them optimal. Momentum is in price units and cannot be compared across instruments; ROC is in percent and can.
Note that academic "momentum" — Jegadeesh and Titman's finding that stocks that beat the market over the last year tend to keep beating it for a few months — is a different thing: a cross-sectional ranking of many stocks against each other, not a single line under one chart. The chart indicator borrowed the word, not the evidence.
The formulas, in words
Momentum = close − close n bars ago
ROC = 100 × (close − close n bars ago) ÷ close n bars ago
No smoothing in the basic form. Some platforms plot momentum as a ratio (close ÷ old close × 100, centred on 100) and still call it momentum; check the label.
Worked example
Close 108, close five bars ago 100. Momentum 8; ROC 8%. If instead the close were 96: momentum −4, ROC −4%.
The window effect: suppose the closes over six bars were 100, 100, 100, 100, 100, 108 — one big bar at the end. Five-bar ROC today is +8%. Tomorrow the market does nothing and closes at 108 again: ROC is still +8%, comparing 108 with the second 100. Four bars later, still at 108, the 108 itself becomes the comparison bar and ROC drops to 0% — on a day when nothing happened.
How they are read
Above zero: higher than n bars ago. Below: lower. Zero crossings are the price passing its own lagged value, which is sometimes a trend change and often noise. ROC rising while price rises is read as acceleration; ROC falling while price still rises means the last n bars gained less than the n before them. Divergence is that same observation with a name.
When they lie
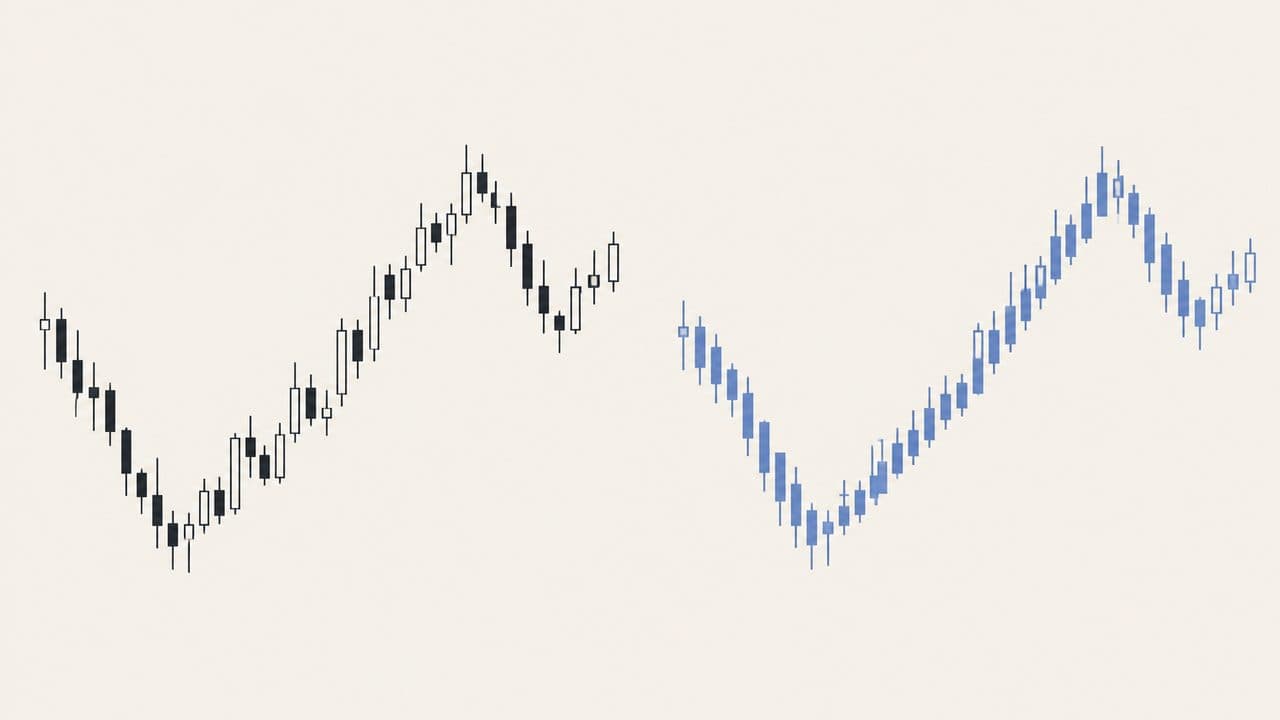
The window effect above, worst with short lags. A small old close makes ordinary changes look like large percentages. Splits, rolls and unadjusted dividends create jumps that are pure data. A gap produces a big reading that describes one instant. Fitting the lag to historical turning points. And a backtest that uses a bar's close before the bar finished.
What they do not tell you
How long a move lasts, why it happened, how volatile the market will be, or whether the instrument is cheap. Whether an 8% reading is one gap or five steady days.
What the evidence actually says
The same three papers apply to every indicator in this series, so the short version: Brock, Lakonishok and LeBaron (1992) found simple moving-average and trading-range rules carried information on ninety years of the Dow; Sullivan, Timmermann and White (1999) showed that once you count how many rules were tried, the best of them stops being significant — the data-snooping result; Park and Irwin (2007) reviewed ninety-five later studies and found roughly half positive, a quarter negative, and most of the positives shrinking after costs. The RSI guide has the longer version.
Levy (1967) and Jegadeesh and Titman (1993) are the papers people cite for "momentum works". Both are about ranking many stocks by past return and holding the winners against the losers. Neither tests a ROC line on a single chart, and neither implies a positive ROC predicts the next bar of anything.
Where it fits
Not a vote on our signal pages, because it is already there in three smoother forms: RSI is momentum bounded, MACD is momentum smoothed, and the stochastic is momentum measured against the range. Reading the raw version once makes the other three easier to distrust correctly.
A note on risk: an indicator that can fall on a day price did not move is telling you about its window, not about the market. Do not trade the window.
Sources
- Murphy, John J., Technical Analysis of the Financial Markets (1999): Google Books
- Levy (1967), "Relative Strength as a Criterion for Investment Selection", Journal of Finance: DOI
- Jegadeesh and Titman (1993), "Returns to Buying Winners and Selling Losers", Journal of Finance: DOI
- Brock, Lakonishok and LeBaron (1992): DOI
- Sullivan, Timmermann and White (1999): DOI
- Park and Irwin (2007): DOI
- Menkhoff and Taylor (2007): DOI
Written by the Ultimo Research Desk and checked against our own contract specifications and client agreement before publication; reviewed again when those change. Educational only — nothing here is a recommendation to trade. Spotted an error? Tell us.