8 minute read · Ultimo Research Desk · Reviewed 23 Sept 2026
Drawdown Explained: How to Measure It and How Much Is Too Much
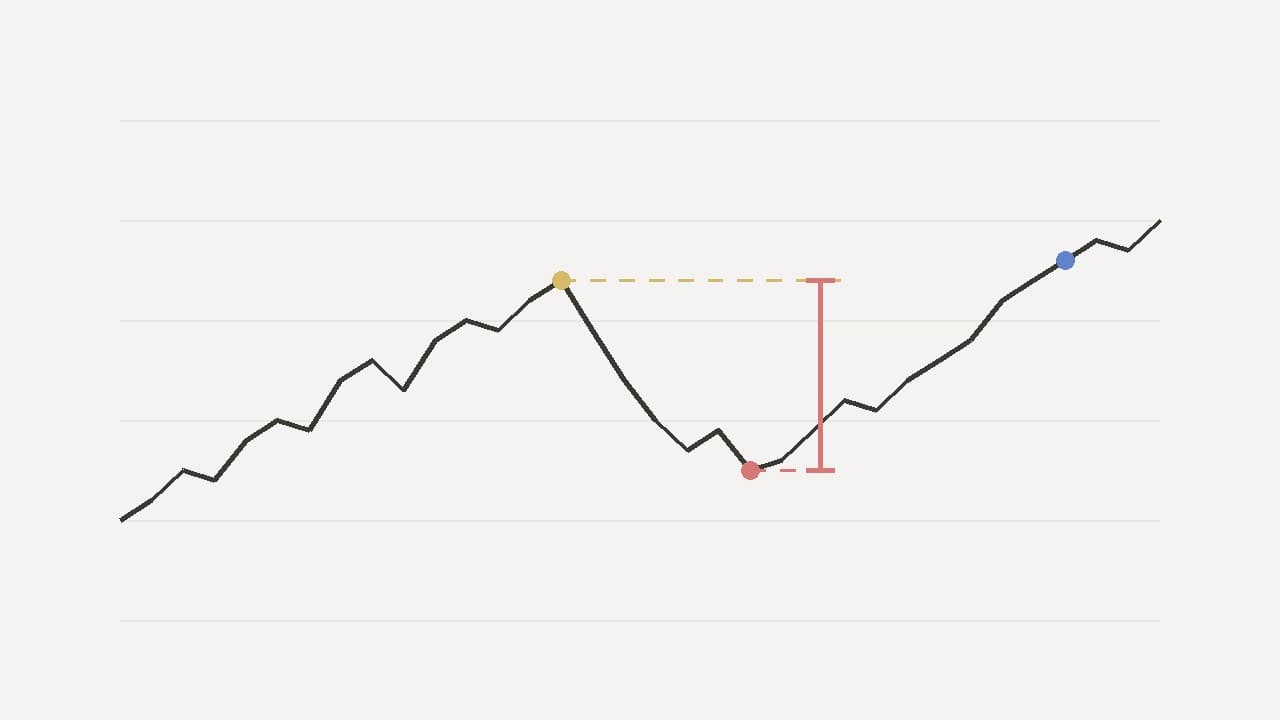
A drawdown is the distance between the highest point your account has reached and where it is now, measured while it is below that high. It is the only number that describes how much a method has cost you at its worst, and it is the number most traders discover the meaning of after the fact rather than before.
This guide is about measuring it properly and deciding, in advance, how much of it you are prepared to see. The arithmetic of climbing back out — and what a run of losses does to your decisions while you are in one — is in After a Losing Run; this piece stops where that one starts.
What drawdown actually measures
Take the highest value your account has ever reached — the peak. Every later reading that is below it is in drawdown, and the drawdown at that moment is the gap between the peak and the reading, usually expressed as a percentage of the peak. The moment the account makes a new high, the drawdown is zero again and a new peak begins.
Three versions of the number are worth keeping apart, because people use the one word for all of them:
- Current drawdown — how far below the last peak you are right now.
- Maximum drawdown — the deepest the account has ever gone below any peak, over the whole history. This is the figure that describes a method's worst stretch, and it is the one to compare with your own limit.
- Relative versus absolute — relative is a percentage of the peak; absolute is a currency amount, or a percentage of the starting balance. A 20% relative drawdown from a peak of 15,000 USD is 3,000 USD; the same 3,000 USD from a starting balance of 10,000 USD is a 30% absolute drawdown. The two can describe the same week and produce different-sounding numbers.
The percentage matters because the recovery is not symmetrical. A 10% drawdown needs an 11.1% gain to get back to the peak; 25% needs 33.3%; 50% needs 100%. The mechanism is in the losing-run guide, and the practical consequence is that drawdown is not a linear measure of how much trouble you are in. The second 25% is far more expensive than the first.
Balance drawdown and equity drawdown are different numbers
On MetaTrader 5 you have two figures for what the account is worth. Balance counts closed trades only. Equity is balance plus the floating profit or loss of everything still open. A drawdown can be measured on either, and they tell different stories.
Balance drawdown only moves when a trade closes, so it lags. An account can show a balance drawdown of 4% while carrying open positions that are 12% underwater — the balance figure will catch up the moment those positions close, or when the margin call closes them for you. Equity drawdown is the honest one, because it is the figure the trade server uses when it decides whether your positions can stay open. The margin call guide explains where that line sits.
The practical rule: measure your drawdown on equity, and measure it at the worst point of the day, not at the close. A method that carries positions through news and shows a calm balance curve can still be producing intraday equity drawdowns that would have ended the account on a worse day.
Deciding how much is too much — before you start
The limit has to be set before the first trade, because after the first losing week every number will look either alarmist or too lenient depending on how the week went. Three things go into it.
How much you can afford to lose entirely. Not the balance — the amount whose loss changes nothing about your life. If that is the whole balance, the balance is right. If it is not, the balance is too large, and no drawdown limit fixes that.
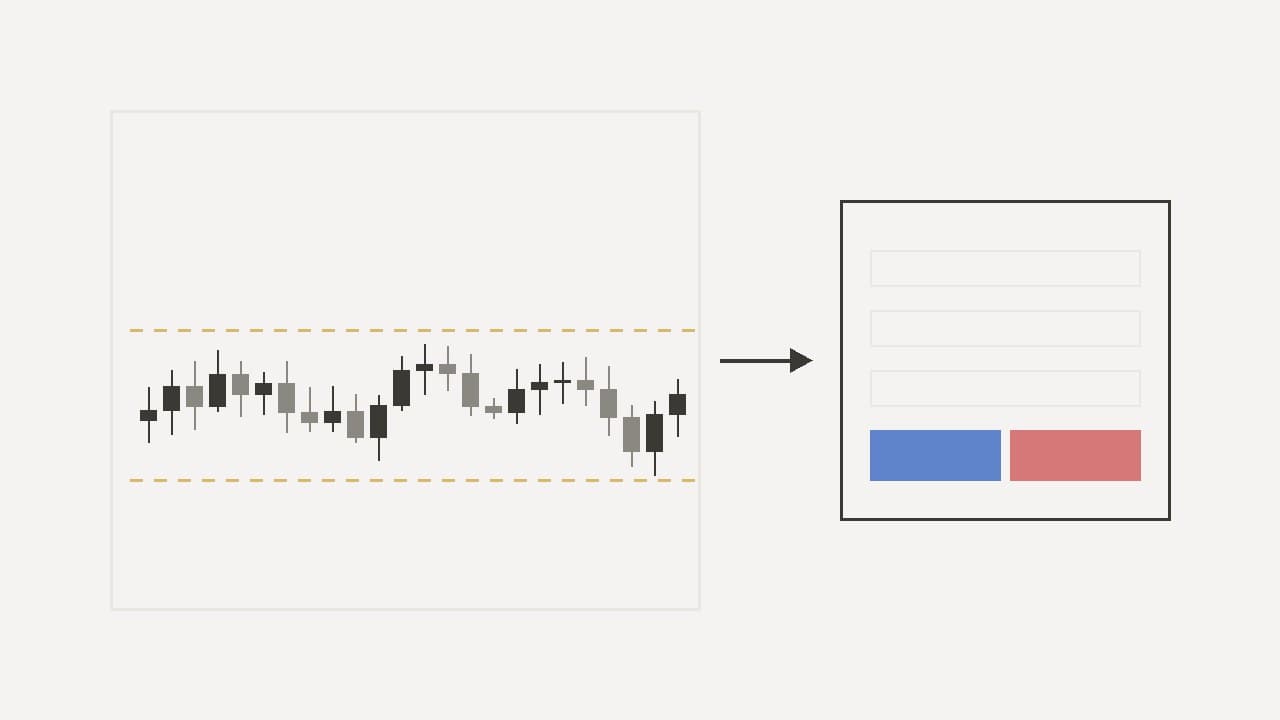
What your method's worst stretch looks like. With a win rate and an average reward-to-risk in hand, you can estimate how deep a run of ordinary bad luck can go. A method that wins 45% of its trades at 1% risk each will produce runs of six, seven and eight consecutive losses as a matter of course — not as a sign of failure. If your limit is 5%, that method will hit it on variance alone, and you will abandon a working approach for a random reason. The limit must sit comfortably beyond the drawdown the method produces when nothing is wrong.
The recovery you are willing to face. At 20% down, you need a 25% gain to get back. At 30%, 43%. Beyond that the arithmetic starts to dictate behaviour — the temptation to increase size to get back faster is exactly the move that turns 30% into 60%. For a method sized at around 1% per trade, somewhere between 15% and 25% of equity is a defensible range, and the value of writing it down is not the precise figure. It is that a limit you set on a calm Sunday is one you did not set while losing.
Write it as a currency amount as well as a percentage. "20%" is a concept; "3,000 USD" is a line on a screen, and the second one gets obeyed.
What to do when the limit is reached
The limit is worthless unless the action attached to it is decided in advance and does not require judgement at the moment it triggers. Something like:
- Close every open position. Not "review them" — close them.
- No new trades for a fixed period. A week is a reasonable default; the point is that it is long enough to break the sequence, not that it is any particular length.
- Halve the position size when trading resumes, and write down the condition for returning to full size — a number of trades, a recovered percentage, whatever it is — before the first reduced-size trade.
- Go back through the trades that produced the drawdown and sort them into two piles: taken according to the rules, and not. The first pile is variance and needs no fixing. The second pile is the problem, and it is usually small and specific.
Step four is the one people skip, and it is the one that separates a drawdown that teaches something from one that merely costs something.
A worked example
An account starts at 10,000 USD and reaches a peak of 12,000 USD after a good two months. Over the next three weeks it falls to 9,600 USD on equity.
- Current drawdown from the peak: (12,000 − 9,600) ÷ 12,000 = 20%.
- Absolute drawdown from the start: (10,000 − 9,600) ÷ 10,000 = 4%.
- Gain needed to return to the peak: (12,000 − 9,600) ÷ 9,600 = 25%.
Both drawdown figures are true. The 20% is the one that matters, because it is the one the limit was written against. If the limit was 20% of equity, the fall to 9,600 USD is the trigger — not "nearly there," not "let this last trade play out." The account is 400 USD below where it started, which sounds mild; it is also a quarter of its value away from where it was, which does not.
Had the same three weeks been traded at half size, the equity would sit near 10,800 USD — a 10% drawdown, with the method intact and the decision still yours to make. That is the whole case for the reduced-size rule: it buys time to find out whether anything is actually wrong.
Where drawdown limits fail
Three ways the limit gets defeated in practice, all of them by the person who set it.
Measuring on balance while carrying losers. The open positions are the drawdown. Closing your eyes to them does not change the equity figure the server sees.
Moving the limit. A limit that is raised the day it is reached was never a limit. If the number was wrong, change it on a calm day after the fact, with the reasoning written next to it — not on the day.
Treating a new deposit as a reset. Adding funds to an account in drawdown does not end the drawdown; it makes the peak-to-trough figure look smaller by changing the denominator. Keep measuring from the original peak, adjusted for the deposit, or the limit means nothing.
The position size calculator turns a risk percentage into lots for the stop distance you have chosen; the profit and loss calculator shows what a given move does to an open position before you are in it. Neither will set the limit for you. That is the part that has to be done in advance, in writing, by you.
Trading leveraged products puts your capital at risk, and a drawdown limit reduces the damage a bad stretch does; it does not prevent the stretch.
Written by the Ultimo Research Desk and checked against our own contract specifications and client agreement before publication; reviewed again when those change. Educational only — nothing here is a recommendation to trade. Spotted an error? Tell us.