8 minute read · Ultimo Research Desk · Reviewed 23 Sept 2026
Position Sizing Discipline: Why the Rule Only Matters in a Bad Week
Position sizing is the arithmetic that decides how many lots to trade so that a stop being hit costs a fixed fraction of the account. The arithmetic is not difficult and most traders learn it in the first month. What fails is not the arithmetic. It is the discipline to keep doing it in the week when every instinct says the rule is what is stopping you from getting your money back.
This guide covers the practice — the order of operations, the pip-value trap, correlated positions — and then the five ways sizing breaks. The underlying rules are in Forex Risk Management; this is what applying them looks like on an ordinary Tuesday and on a bad one.
Size from the stop, not the other way round
The most common sizing error is a matter of sequence. The trader decides on a size — one lot, because it is a round number, or because that is what they traded last time — and then places the stop where it "fits" the size. The stop ends up where the loss is tolerable rather than where the trade is wrong, which means it is hit by noise and honoured by nobody.
The correct order is the reverse, and it is fixed:
- Decide where the trade is wrong. That is where the stop goes — a level, not a distance.
- Measure the distance from entry to stop, in pips or points.
- Decide what the account risks on this trade — the fixed fraction, say 1%.
- Divide the risk amount by the stop distance multiplied by the pip value, and that is the size.
Step four is what the position size calculator does. The discipline is in steps one and three: the stop is set by the chart and the risk is set by the plan, and neither is adjusted to make the size feel better.
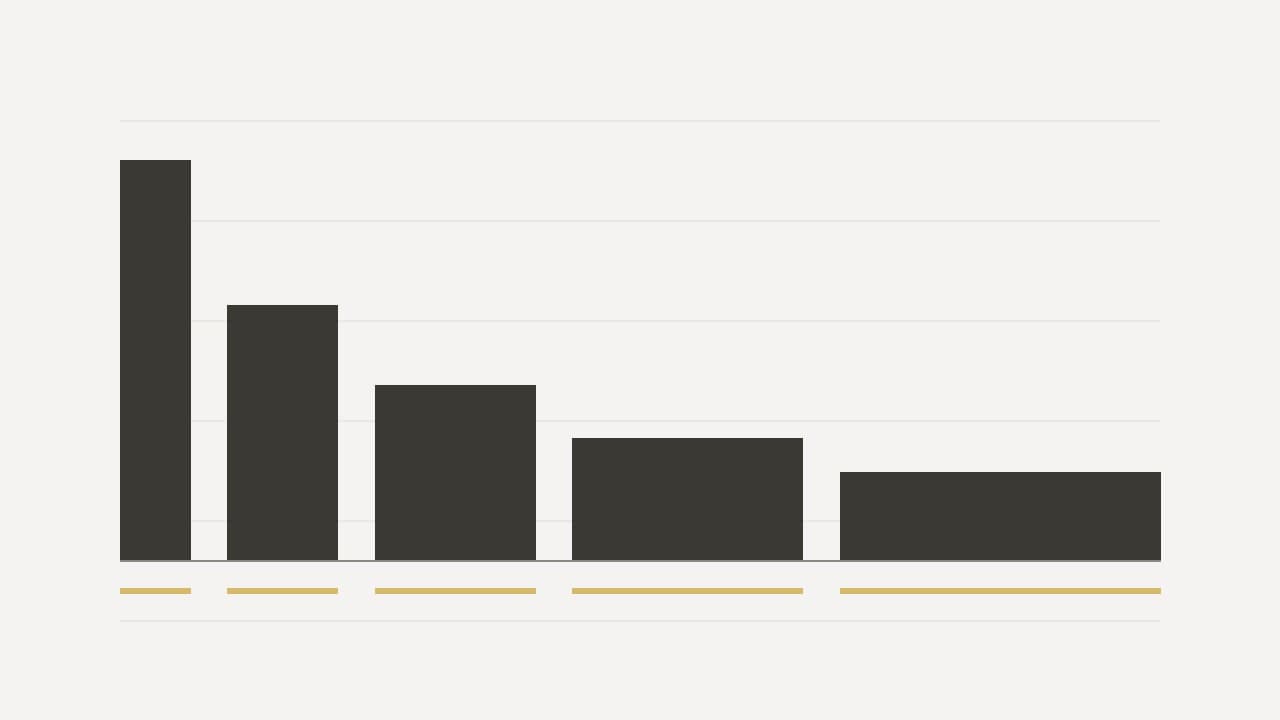
A consequence worth stating plainly: with a fixed fraction, a wider stop means a smaller position, not a larger loss. The five rectangles in the image above are the same risk taken with five stop distances. A trader who understands that stops arguing with wide stops, because a wide stop costs size, not money.
The pip-value trap
One pip is not worth the same on every instrument, and the difference is large enough to turn a 1% risk into a 3% risk on the same lot size.
On a USD-quoted major like EUR/USD, one pip on one standard lot is 10 USD. On USD/JPY, the pip is a different fraction of price and its value in USD depends on the current rate — around 6 to 7 USD per lot at rates seen in recent years, and it moves as the rate moves. On gold, a "pip" is not a standard unit at all: XAU/USD is quoted to two decimals and one lot is 100 ounces, so a 1.00 move is 100 USD per lot. On an index CFD, the value of a point depends on the contract size in the specifications, which differs by index.
The trap is carrying a lot size from one instrument to another. A trader who is comfortable at 0.5 lots on EUR/USD and opens 0.5 lots on gold with a "similar-looking" stop has usually multiplied their risk several times without noticing. The pip calculator gives the value per pip for the instrument and lot size in question; the sizing calculation must be redone for every instrument, every time, from the stop.
Correlated positions are one position
Two positions that move together are not diversification; they are one position at twice the size. Long EUR/USD and long GBP/USD is, most days, one bet on the dollar falling. Long EUR/USD and short USD/CHF is close to the same bet again. Long gold and short the dollar index are frequently the same trade wearing two hats.
The sizing rule has to be applied to the combined exposure. If the plan says 1% per trade and 3% total open risk, three correlated 1% positions are not three trades — they are one 3% trade that has used the whole allowance. The simplest discipline: before adding a position, ask what the account loses if every open stop is hit on the same day. If the answer exceeds the total-risk limit, the new position is not available, however good it looks.
Five ways sizing breaks
Every one of these is a decision that feels reasonable at the moment it is made, and every one is a sizing rule being abandoned in disguise.
Adding to a loser. The position is down, the level "still holds," so a second entry at a better price halves the average cost. It also doubles the size on a trade that is currently wrong, and it doubles the loss if the stop is hit. Averaging into a losing position is the single most reliable way to convert a planned 1% loss into an unplanned 4% one.
Moving the stop to fit the pain. The loss is approaching, the stop is widened "to give it room." The size was calculated for the original stop; the widened stop has silently increased the risk by the same proportion, and nobody recalculated. A stop that moves away from price is a size increase, whatever it is called.
Increasing size to recover. After a loss, the next trade is taken larger so that a win makes back both. This is the mechanism by which a losing run becomes a blown account, and the losing-run guide describes why it feels so persuasive at the time. The plan's answer is the opposite: after a run of losses, size goes down, not up.
Sizing on balance while carrying open losers. If the account balance is 10,000 USD and open positions are 800 USD underwater, the account is 9,200 USD. Sizing the next trade on 10,000 is a small overstatement, but it compounds — the more positions are open and losing, the more the "1%" drifts above 1%. Size on equity.
Ignoring the gap. A stop is a request to close at a price; it is not a guarantee of that price. Over a weekend, or on a news release, the market can open beyond the stop and the fill is at the next available price. On instruments prone to gaps, the sizing has to allow for a loss larger than the stop distance implies — either by smaller size, or by not holding through the event. The economic calendar shows when the scheduled ones are; the unscheduled ones are why the total-risk limit exists.
A worked example
Account equity is 8,000 USD; the plan risks 1% per trade, so 80 USD.
Trade one, EUR/USD. Say entry 1.0850, stop 1.0820 — 30 pips. At 10 USD per pip per lot, one lot would risk 300 USD. Size = 80 ÷ 300 = 0.27 lots (0.26 rounded down if the platform's step requires it).
Trade two, gold, the same day. Say entry 2,380.00, stop 2,368.00 — a 12.00 move. One lot of XAU/USD is 100 ounces, so a 12.00 move is 1,200 USD per lot. Size = 80 ÷ 1,200 = 0.07 lots (rounded down from 0.067).
The EUR/USD position is four times the lot size of the gold position and carries exactly the same risk. A trader who had opened 0.27 lots of gold "to match" would have been risking 324 USD — over 4% of the account — on one trade, with the plan saying 1%.
Now suppose EUR/USD is also long and the trader wants to add long GBP/USD at 1% too. Total open risk with all three: 3% — within a 3% limit, but only if the plan treats the two dollar shorts as what they are, which is most of one bet. On a day the dollar rallies, both stops are hit together and the account is down 2% from what was, in effect, a single view.
The discipline, stated plainly
The rule is not "risk 1%." The rule is: the stop comes from the chart, the risk comes from the plan, the size is whatever those two numbers produce, and none of the three is adjusted after the trade is on. The bad week is the only test of it, because in a good week the rule costs nothing to keep.
Trading leveraged products puts your capital at risk; consistent sizing limits what any single trade can cost and does not make the trade more likely to succeed.
Written by the Ultimo Research Desk and checked against our own contract specifications and client agreement before publication; reviewed again when those change. Educational only — nothing here is a recommendation to trade. Spotted an error? Tell us.