6 minute read · Ultimo Research Desk · Reviewed 5 Sept 2026
Mean Reversion: What It Is, What It Requires and Where It Fails
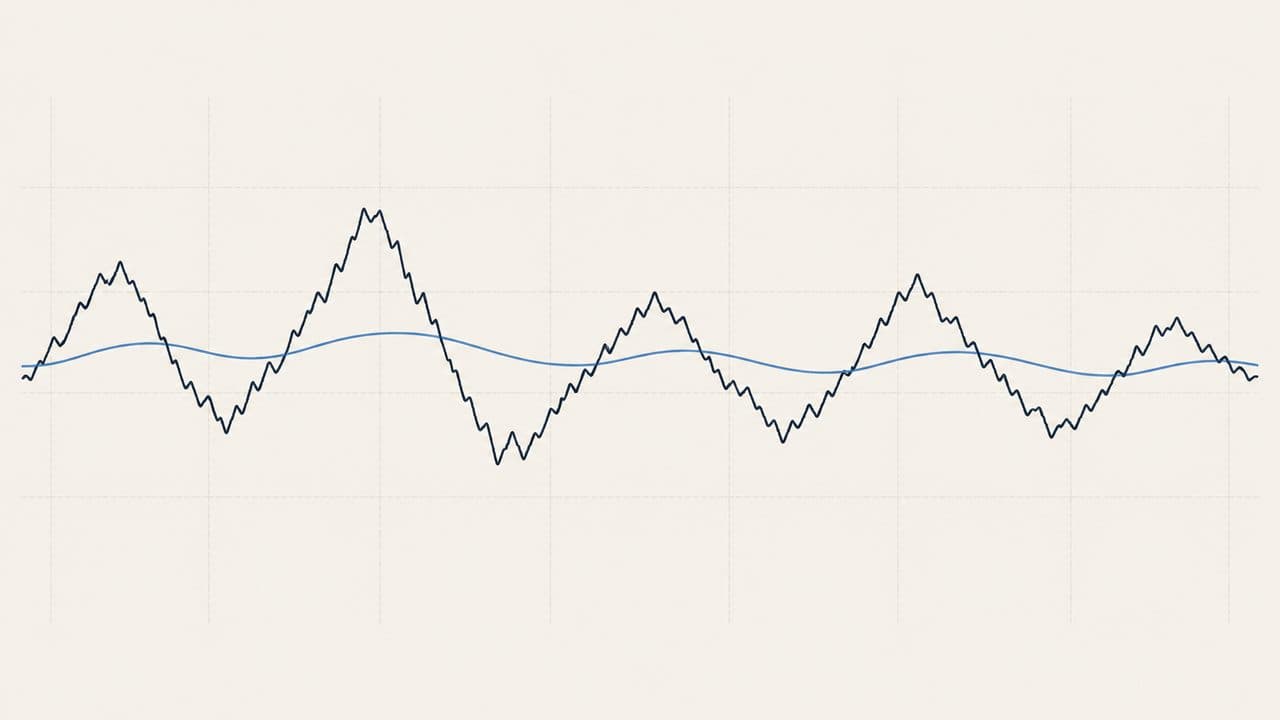
Mean reversion is an approach that treats a price, spread or return as likely to move back towards a defined reference after a deviation. It depends most on that reference remaining economically meaningful while the position is open; a new regime can make the old mean irrelevant.
What it is
The approach begins with a mean. The mean may be a moving average of price, a volume-weighted average, the historical average of a spread between related instruments, or a valuation measure. The model then measures the distance from that reference. A trade is considered mean-reverting when the distance narrows, while a persistent widening is treated as contrary evidence.
Mean reversion can be applied to shares, indices, foreign exchange, interest-rate instruments, commodities and relative-value pairs. Short-horizon versions may hold for minutes or days. Longer-horizon versions may use monthly returns or valuation ratios and hold for months or years. The statistical idea has no single trading inventor. Research on long-horizon return reversals and transitory price components is one documented origin of the modern discussion.
A price can be close to its recent mean while the underlying economic value has changed. A spread between two instruments can also appear stable until a relationship breaks. Mean reversion is therefore not the same as “price must return”. It is a conditional description that requires a reason for the reference level and a method for detecting when the relationship has changed.
What it requires
The approach requires a clearly defined mean, a window for measuring it and a rule for what counts as an abnormal deviation. The longer the window, the more historical information enters the reference. The shorter the window, the more quickly the mean changes. Statistical tests require enough observations to distinguish a recurring relationship from a chance pattern.
Capital must allow a position to move farther from the mean before convergence. A position can remain adverse longer than planned, so required capital is linked to the closing distance, instrument volatility and the potential for a structural break.
Execution quality is important because the expected price move may be small relative to spread and commission. Data must be synchronised when two instruments form a spread. Corporate actions, contract changes and different trading sessions can create artificial deviations. Regular monitoring is required when the mean is recalculated daily or when new information can change the relationship.
How it is implemented
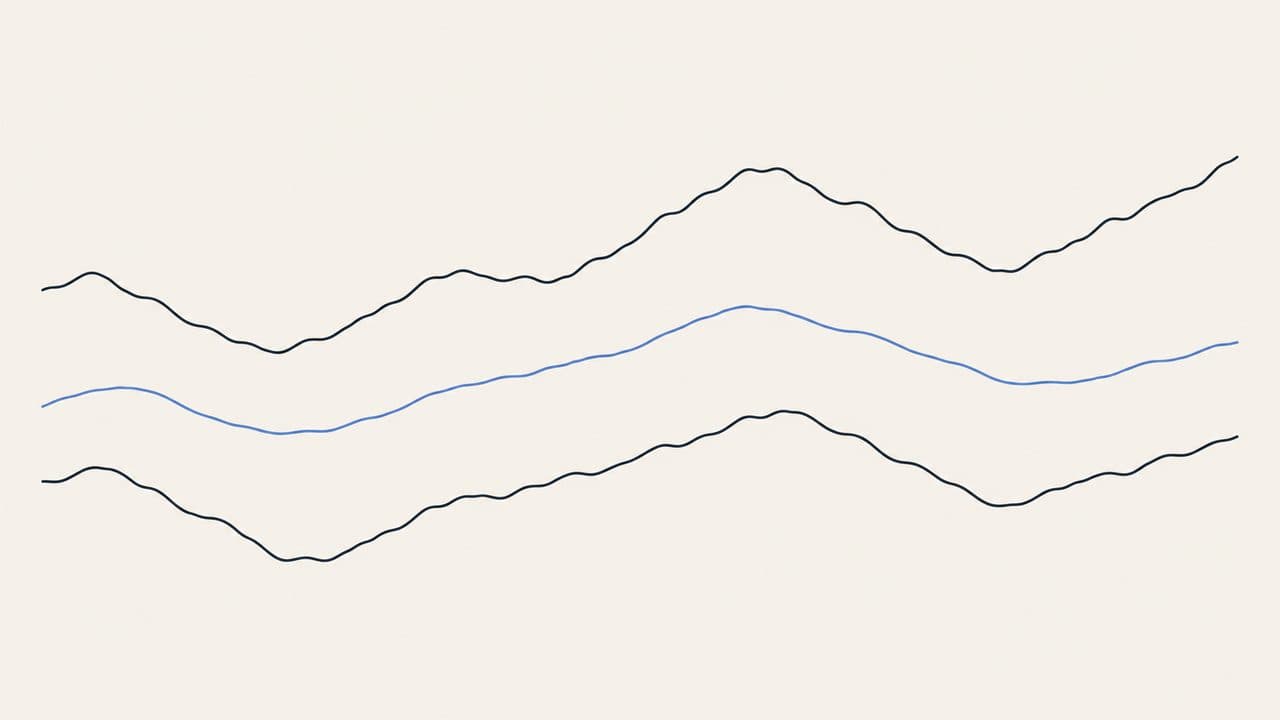
An implementation defines the reference and measures the deviation in price units, percentage terms or standard deviations. A common statistical description is a z-score: current value minus the mean, divided by the historical standard deviation of the same series; Bollinger Bands draw the same measure on a chart. The position is opened, reduced or closed according to fixed deviation and time conditions. The model must also specify what happens when the deviation widens rather than narrows.
For a pair or spread, the two legs are sized using a stated relationship rather than assuming that equal cash amounts remove risk. For a single instrument, size may be linked to volatility or to the distance between the entry and the invalidation level. Exit conditions can be a return to the mean, a maximum holding time, a new volatility regime or a breach of the relationship. These mechanics describe the approach; they do not establish that a particular rule will produce a desired result.
Worked example
Suppose five recent closing prices are 98, 99, 100, 101 and 102. The simple mean is (98 + 99 + 100 + 101 + 102) ÷ 5 = 500 ÷ 5 = 100. The current price is 98, which is 98 − 100 = −2 price units from the mean.
Assume one unit is bought at a mid-price of 98. The round-trip spread cost is assumed to be 0.10. Commission is assumed to be 0.20 on entry and 0.20 on exit. Financing is assumed to be 0.05 per day for two days, or 2 × 0.05 = 0.10. Total cost is 0.10 + 0.20 + 0.20 + 0.10 = 0.60.
In a converging case, the exit mid-price is 100. Gross result is 100 − 98 = 2.00. Net result is 2.00 − 0.60 = 1.40 price units.
In a widening case, the exit mid-price is 95. Gross result is 95 − 98 = −3.00. Net result is −3.00 − 0.60 = −3.60 price units. The figures are illustrative. They show that the distance to the mean is not a limit on the distance price can travel away from it.
Costs
Spread and commission are significant when the expected reversion is small. A model that opens and closes often pays those costs repeatedly. Slippage can be greatest when a deviation is caused by news, a gap or a change in liquidity. A price used in a back-test may not be available at the time the statistical condition is observed.
Financing affects positions held beyond the daily cut-off. A pair may carry two financing charges, two sets of dealing costs and a mismatch between the instruments’ trading hours. Short exposure can have additional availability or funding constraints. If the mean is based on a rolling window, the reference itself can move through the position and create turnover without an equivalent change in the underlying relationship.
Where it fails
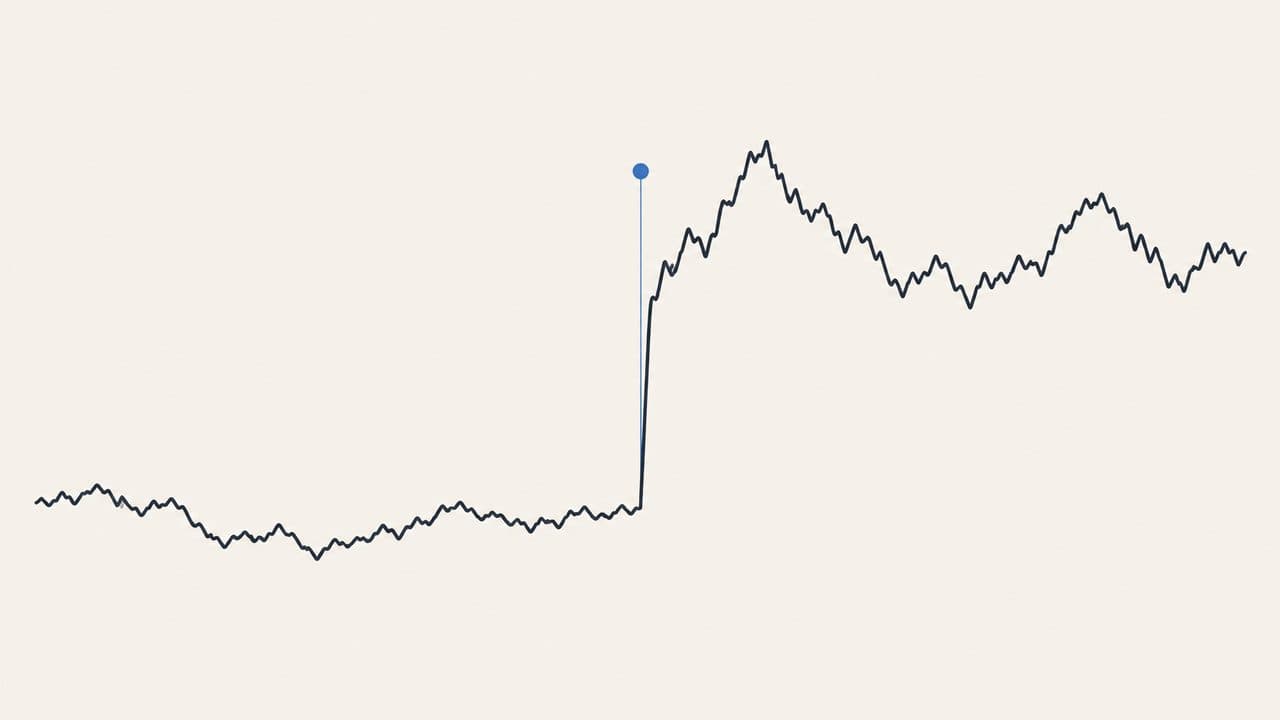
Mean reversion is hurt by a persistent trend, a permanent change in value or a breakdown in the relationship between two instruments. A company can experience a lasting earnings change. A currency can reprice after a policy change. A spread can widen because one side has become riskier. In each case, waiting for the old mean can increase the loss rather than reduce it.
Short windows can mistake noise for a signal, while long windows can make the reference stale. A gap may pass through several deviation levels before an order can be filled. Thin markets can create false extremes or unreliable standard deviations. Behavioural errors include adding size as the position moves against the mean, removing the invalidation condition, or treating an earlier convergence as evidence that the next deviation will behave the same way.
Who it suits and who it does not
Mean reversion is more compatible with a reader who can define and monitor a reference, wait through adverse movement and accept that the relationship may need to be abandoned. It requires sufficient capital for positions that may remain open while the deviation widens, as well as data that can be compared consistently.
It is less compatible with someone who cannot monitor structural news, cannot hold through temporary adverse movement, or expects every extreme reading to return quickly. It is also unsuitable when the available instrument or data does not support a stable and economically explainable reference.
What the evidence says
Poterba and Summers (1988) examined transitory components and long-horizon mean reversion in stock prices. Their results were part of a debate about sampling, variance-ratio methods and the interpretation of long-horizon dependence. They do not validate a short-term moving-average rule or establish that an individual price will return to a recent mean.
De Bondt and Thaler (1985) reported long-horizon reversal patterns in portfolios formed from past winners and losers. That evidence concerns portfolio formation and a multi-year horizon, not a retail chart signal. Park and Irwin (2007) reviewed technical-analysis research and reported that findings vary with markets, periods, testing methods and dealing costs. The evidence supports testing the definition of the mean and the regime assumptions; it does not establish a general predictive rule.
Sources
- Poterba and Summers (1988), “Mean Reversion in Stock Prices: Evidence and Implications”, DOI.
- De Bondt and Thaler (1985), “Does the Stock Market Overreact?”, DOI.
- Park and Irwin (2007), “What Do We Know About the Profitability of Technical Analysis?”, DOI.
- Lo, Mamaysky and Wang (2000), “Foundations of Technical Analysis: Computational Algorithms, Statistical Inference, and Empirical Implementation”, DOI.
- John J. Murphy, Technical Analysis of the Financial Markets (1999), Google Books.
Educational only: Mean reversion can become more adverse when the reference level is stale or the underlying relationship changes.
Written by the Ultimo Research Desk and checked against our own contract specifications and client agreement before publication; reviewed again when those change. Educational only — nothing here is a recommendation to trade. Spotted an error? Tell us.