6 minute read · Ultimo Research Desk · Reviewed 5 Sept 2026
Breakout Trading: What It Is, What It Requires and Where It Fails
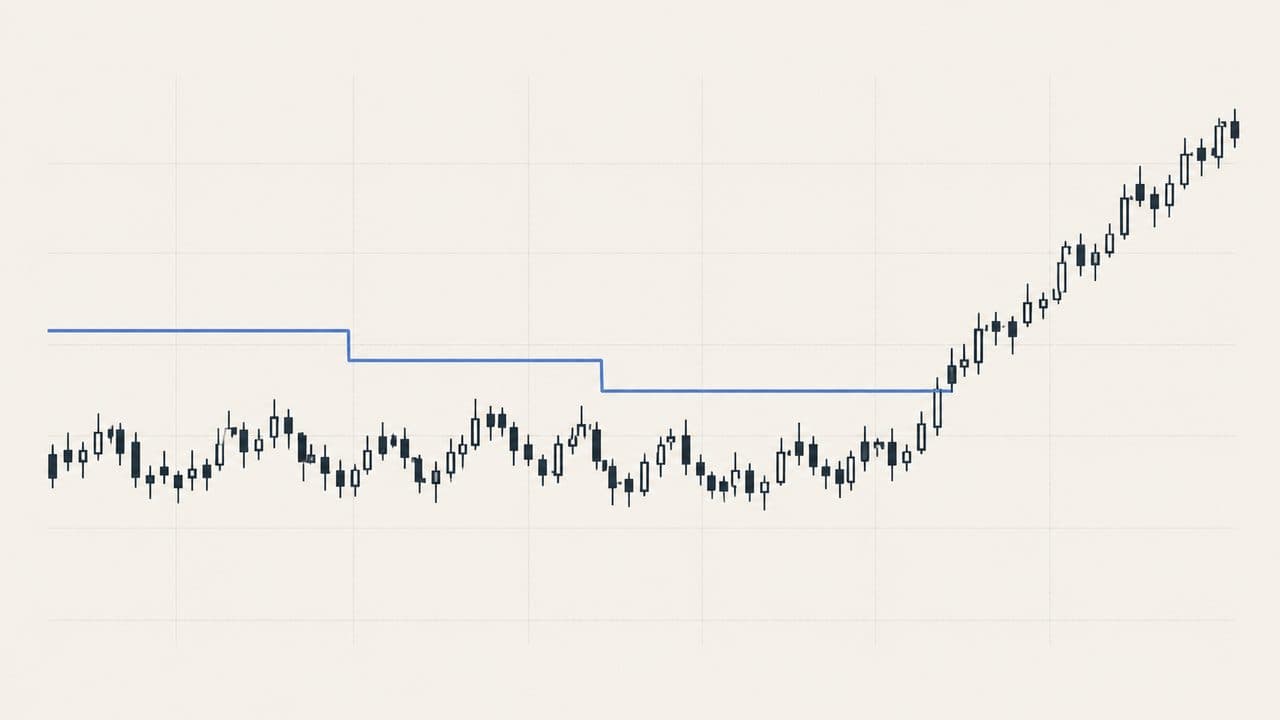
Breakout trading responds when price moves beyond a previously defined range, high, low or volatility boundary. It depends most on the move after the boundary being large or persistent enough to compensate for false signals and the cost of entering after price has already moved.
What it is
A breakout is a comparison between a current price and a past reference. The reference may be the highest high and lowest low of a rolling window, a support or resistance level, a consolidation range, a volatility band or a prior session extreme. The approach does not require that every new high or low marks a new trend. It requires a defined way to distinguish a meaningful boundary event from an ordinary fluctuation.
Breakouts are applied to equity indices, shares, foreign exchange, commodities, interest-rate instruments and other markets with observable price history. The holding period can be intraday, several days or several months. Short windows produce more boundary events and more sensitivity to market noise. Long windows produce fewer events and can enter after a larger part of the move has occurred. Richard Donchian’s channel work and the trading-range rules studied by Brock, Lakonishok and LeBaron are documented influences, but breakout trading is a broad family rather than a single originator’s formula.
A range can be defined from closing prices, intraday highs and lows, or a volatility-adjusted measure. The inclusion rule must be specified. A current bar that makes the new high cannot be used to define a signal and to assume a fill before that high was known. This timing issue is central when a historical breakout is tested.
What it requires
Breakout trading requires historical data with reliable highs, lows, closes and session boundaries. It also requires a process for monitoring the instrument when the range is close to being exceeded. An approach based on completed daily candles does not need constant screen time, but a fast intraday method does. The available attention must match the signal interval.
Capital must allow for a sequence of failed breaks. A stop or invalidation level can be close to the entry, but the gap between the intended level and the actual fill can be larger. A portfolio approach may spread signals across instruments, but markets can become correlated during a shock. Position sizing is therefore commonly linked to the distance to the exit level, recent volatility or a fixed risk amount.
Liquid instruments and reliable order handling help when the price is moving quickly through the boundary. Data latency, stale highs and lows, contract rolls and corporate actions can change the level. A model may also need rules for market closures, overnight gaps and whether a signal remains valid after a failed move back inside the range.
How it is implemented
An implementation first defines the range and the observation used to confirm the break. It may require a trade through the level, a completed close beyond it or a retest that remains outside the range. The position direction follows the side of the boundary in the model. An exit may be an opposite boundary, a trailing reference, a fixed time or a predefined invalidation level.
The position size is usually linked to the distance between the entry and the chosen exit level. A wider range can produce a smaller position for the same stated risk amount. Some models apply a volatility filter or require a minimum range width. Those filters change the approach and must be included in any evaluation. The mechanics describe how a breakout is defined; they do not establish that a break will continue.
Worked example
Assume the upper boundary of a prior range is a mid-price of 100. The current mid-price crosses that level. Use one unit, a round-trip spread cost of 0.20, total commission of 0.40 and assumed slippage of 0.20, split between entry and exit. Total cost is 0.20 + 0.40 + 0.20 = 0.80.
In a continuation case, the exit mid-price is 104. Gross result is 104 − 100 = 4.00. Net result is 4.00 − 0.80 = 3.20 price units.
In a false-break case, the exit mid-price is 99. Gross result is 99 − 100 = −1.00. Net result is −1.00 − 0.80 = −1.80 price units. The example treats all costs as explicit assumptions. It shows why a boundary can be crossed and then lost without the approach having a second source of information about the next price.
Costs
Spread, commission and slippage are concentrated around the signal because a break often occurs during increased activity. Slippage can be greater than the normal spread when several orders respond to the same level or when a gap passes through it. A model that enters on a completed close may face a different fill from one that uses an intrabar price.
Financing applies to positions held overnight. A longer holding period can make the initial dealing cost smaller relative to the movement, but it exposes the position to more news, gaps and financing days. Contract rolls, currency conversion and data costs also matter in a multi-market approach. Tests that use the boundary price as the fill and omit failed-break costs do not reproduce live conditions.
Where it fails
The main failure is a range with repeated false breaks. Price can cross the same boundary, return inside the range and cross again in the opposite direction. A narrow range can make a small fluctuation appear significant. A wide range can delay the signal until the price has already travelled a material distance.
Breakouts also fail after a news gap when the initial direction reverses quickly. A stale high, low or session boundary can create a level that does not represent current liquidity. Parameter fitting can select a look-back that describes one historical market unusually well. Behavioural errors include moving the exit farther after a failed break, increasing size after a winning break or cancelling the method after a normal run of losses.
Who it suits and who it does not
Breakout trading is more compatible with someone who can accept false signals, monitor the relevant boundary and hold a position through an uncertain early phase. It requires enough capital to withstand repeated small losses and the ability to account for slippage during fast moves.
It is less compatible with someone who cannot monitor market openings or gaps, needs a high proportion of immediately correct signals, or cannot define the range and timing rules in advance. It is also less suitable for an instrument whose highs, lows or volume are unreliable.
What the evidence says
Brock, Lakonishok and LeBaron (1992) tested moving-average and trading-range break rules on a long Dow Jones sample. Their paper is relevant to the historical study of range breaks, but it tests specified rules, markets and dates rather than every breakout method. The result does not establish that a current break will continue or that a retail implementation will reproduce the historical sample.
Sullivan, Timmermann and White (1999) examined data-snooping effects in technical-rule research and showed why selecting a rule from a large set can exaggerate historical evidence. Park and Irwin (2007) reviewed the broader literature and described mixed findings after considering testing methods and costs. The evidence supports distinguishing a descriptive boundary event from a claim about future direction.
Sources
- Brock, Lakonishok and LeBaron (1992), “Simple Technical Trading Rules and the Stochastic Properties of Stock Returns”, DOI.
- Sullivan, Timmermann and White (1999), “Data-Snooping, Technical Trading Rule Performance, and the Bootstrap”, DOI.
- Park and Irwin (2007), “What Do We Know About the Profitability of Technical Analysis?”, DOI.
- John J. Murphy, Technical Analysis of the Financial Markets (1999), Google Books.
Educational only: Breakout trading is exposed to false breaks, gap risk and slippage when price moves quickly through a boundary.
Written by the Ultimo Research Desk and checked against our own contract specifications and client agreement before publication; reviewed again when those change. Educational only — nothing here is a recommendation to trade. Spotted an error? Tell us.