6 minute read · Ultimo Research Desk · Reviewed 5 Sept 2026
Scalping: What It Is, What It Requires and Where It Fails
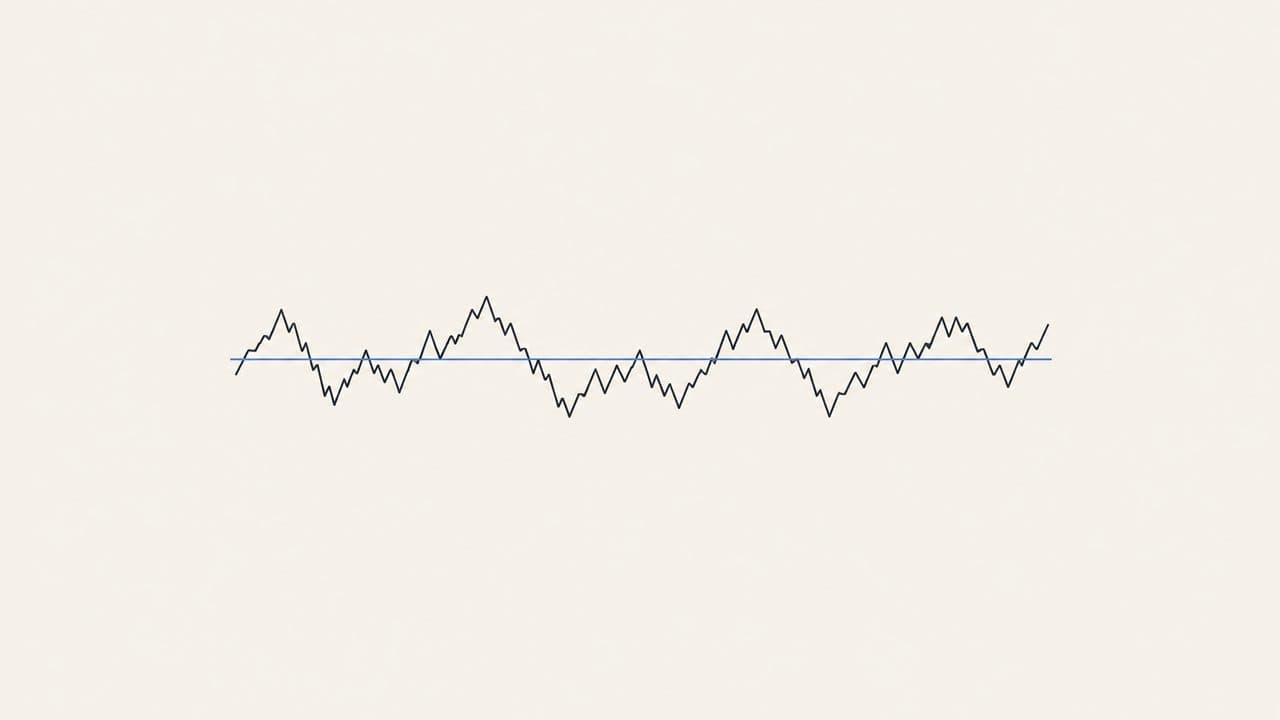
Scalping seeks to capture very small price movements by opening and closing positions over seconds or minutes. It depends most on the price movement available after the spread, commission, slippage and execution delay being large enough to leave a meaningful residual.
What it is
Scalping is the shortest common form of directional trading. A scalper may use a small price imbalance, a short-term range, order-flow information, a scheduled event or a rapid response to a change in the quote. Positions are normally closed quickly, and the method may generate many transactions during one session. The label describes holding time rather than a single model.
The approach is most often associated with liquid shares, equity indices, foreign exchange, futures and other instruments with frequent price updates. It can also be used by market-making and high-frequency firms, but institutional market making and retail directional scalping are different activities. Institutional firms may have direct market access, exchange connectivity and automated order management that are not available through a retail account.
Scalping has no single documented origin. It developed with short-term charting, electronic quotations and the growth of automated market systems. The price interval may be a few ticks, a fraction of a larger currency unit or a small percentage of the instrument’s price. A scalp is therefore highly dependent on the instrument’s tick size, session, liquidity and quote structure.
What it requires
Scalping requires sustained attention during the chosen session. A method that reacts within seconds requires the screen, data and order process to be available continuously. A short interruption can leave an open position without the intended exit. The reader also needs a defined maximum holding time and a way to handle rejected, partial or delayed orders.
Capital is required for the position, the dealing costs and the possibility of repeated losses. The number of transactions can be high even when the position size is small. A scalper must understand the instrument’s minimum price movement, trading hours, quote frequency and liquidity at different times of day. Historical data must preserve the order of quotes or trades if the method depends on intrabar movement.
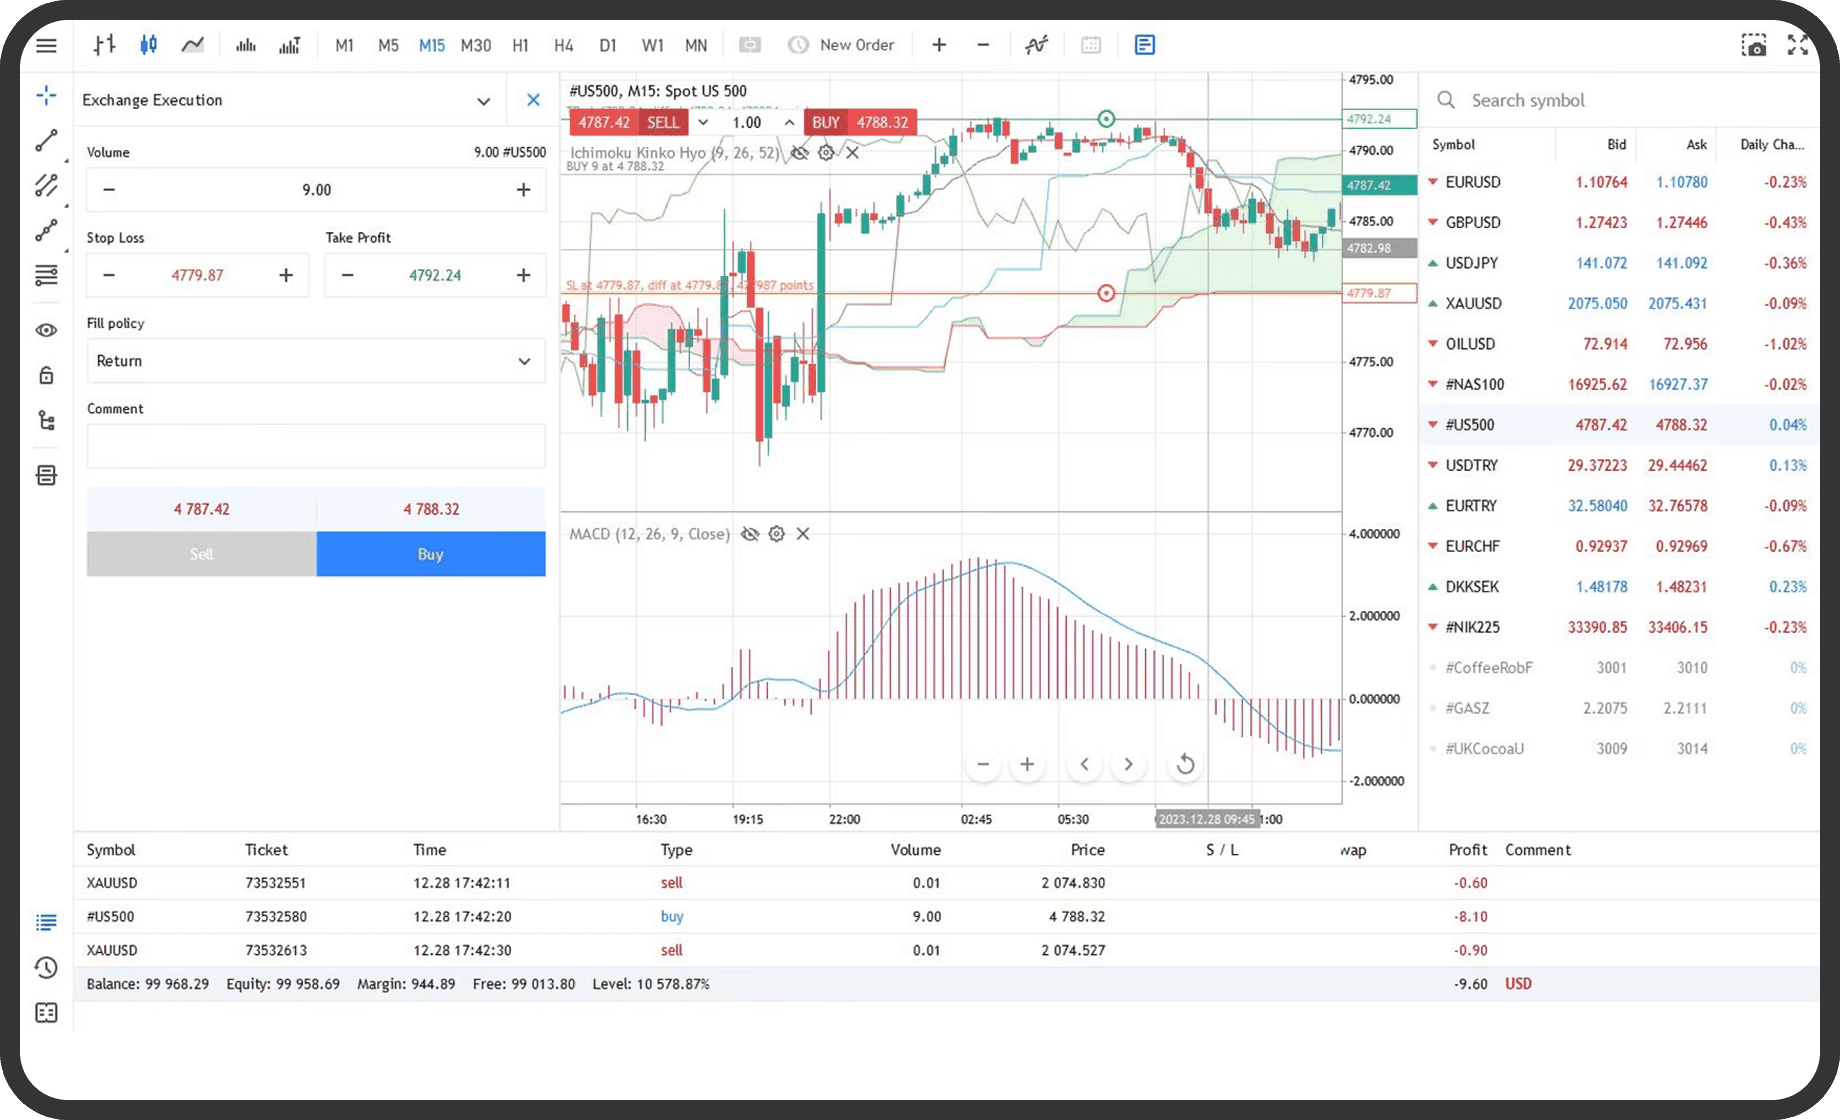
Execution quality is central. A displayed price may change before an order reaches the market. The connection, data feed, order type and server location affect the result. An indicator calculated from a one-minute candle cannot reproduce a decision made from every quote inside that candle. A chart with a smooth line may therefore conceal the operational conditions of a scalp.
How it is implemented
An implementation defines a short-term reference, an entry condition, an exit condition and a maximum holding time. The reference can be a recent high or low, a short moving average, a spread between bid and ask, volume information or an event response. Position size is fixed or linked to the distance to the exit level. A model may close all positions at a session boundary even if the price condition has not occurred.
The implementation must state how it handles a widening spread, an unchanged quote, a fast gap, a partial fill and a position that remains open after the intended time. Automated order handling can reduce manual delay, but it adds software, connection and monitoring requirements. A high number of observations does not remove model risk; it can increase the effect of a small operational error.
Worked example
Assume one unit is bought at a mid-price of 100 and closed shortly afterwards. The round-trip spread cost is assumed to be 0.10. Commission is assumed to be 0.20 on entry and 0.20 on exit. Short-term slippage is assumed to total 0.10. Total cost is 0.10 + 0.20 + 0.20 + 0.10 = 0.60.
In a favourable case, the exit mid-price is 100.80. Gross result is 100.80 − 100 = 0.80. Net result is 0.80 − 0.60 = 0.20 price units.
In an adverse case, the exit mid-price is 99.70. Gross result is 99.70 − 100 = −0.30. Net result is −0.30 − 0.60 = −0.90 price units. The figures are illustrative. They show that the same small movement can be positive before costs and negative after costs, and that the losing case can be several times the favourable net result.
Costs
Scalping is especially sensitive to spread and commission because the intended price movement is small. The cost is paid repeatedly, not only when the day’s final position is closed. Slippage can change from one transaction to the next and can be larger during an event or a thin period. A normal displayed spread is not a fixed cost in a fast market.
Data, connectivity and monitoring costs can also be material. Automated systems require maintenance, testing and controls for stale prices and duplicate orders. Holding beyond the intended interval can introduce financing, and closing a short-lived position at a different session can expose it to a new liquidity condition. A test that assumes entry and exit at the same chart price omits the central cost of the approach.
Where it fails
Scalping is hurt by a widening spread, slow execution, a quote that cannot be filled and a market that remains too quiet for the planned movement. It can also fail during a sharp event when the price moves through several levels before the exit is processed. Repeated small losses can accumulate quickly when the method responds to noise.
Fatigue and overtrading are material behavioural risks. A reader may increase size after a loss, continue after the planned session, or treat an unfilled order as a reason to change the rule. Technical failures, data gaps and duplicate orders can create exposure that is not visible in a later chart review. A model fitted to one feed or one time of day can fail when liquidity changes.
Who it suits and who it does not
Scalping is more compatible with someone who can maintain continuous attention, operate reliable data and order systems, and accept frequent small outcomes. It requires capital for costs and repeated attempts, as well as a clear process for interruptions and unfilled orders.
It is less compatible with someone who cannot watch the chosen session, cannot absorb high turnover costs, or needs a slower decision process. It is also less suitable for instruments with inconsistent quotes, limited liquidity or a price movement too small to cover ordinary costs.
What the evidence says
There is no single peer-reviewed study that validates the common retail scalping label across instruments and implementations. Barber and Odean (2000) found an association between frequent trading and lower net outcomes in their household sample, but their study was not a test of every scalping rule. It does provide relevant evidence that high turnover and active decision-making can materially affect retail results after costs.
Hendershott, Jones and Menkveld (2011) studied algorithmic trading and liquidity in NYSE data. Their findings concern market structure and algorithmic activity, not a retail scalping rule. Park and Irwin (2007) reviewed technical-rule studies and found conclusions dependent on data, methods and costs. The evidence does not provide a general predictive conclusion for scalping; the implementation details are inseparable from the result.
Sources
- Barber and Odean (2000), “Trading Is Hazardous to Your Wealth: The Common Stock Investment Performance of Individual Investors”, DOI.
- Hendershott, Jones and Menkveld (2011), “Does Algorithmic Trading Improve Liquidity?”, DOI.
- Park and Irwin (2007), “What Do We Know About the Profitability of Technical Analysis?”, DOI.
- Sullivan, Timmermann and White (1999), “Data-Snooping, Technical Trading Rule Performance, and the Bootstrap”, DOI.
- John J. Murphy, Technical Analysis of the Financial Markets (1999), Google Books.
Educational only: Scalping is highly sensitive to execution delay, quote quality and repeated dealing costs over very short intervals.
Written by the Ultimo Research Desk and checked against our own contract specifications and client agreement before publication; reviewed again when those change. Educational only — nothing here is a recommendation to trade. Spotted an error? Tell us.