7 minute read · Ultimo Research Desk · Reviewed 5 Sept 2026
Williams %R: What It Measures and When It Lies
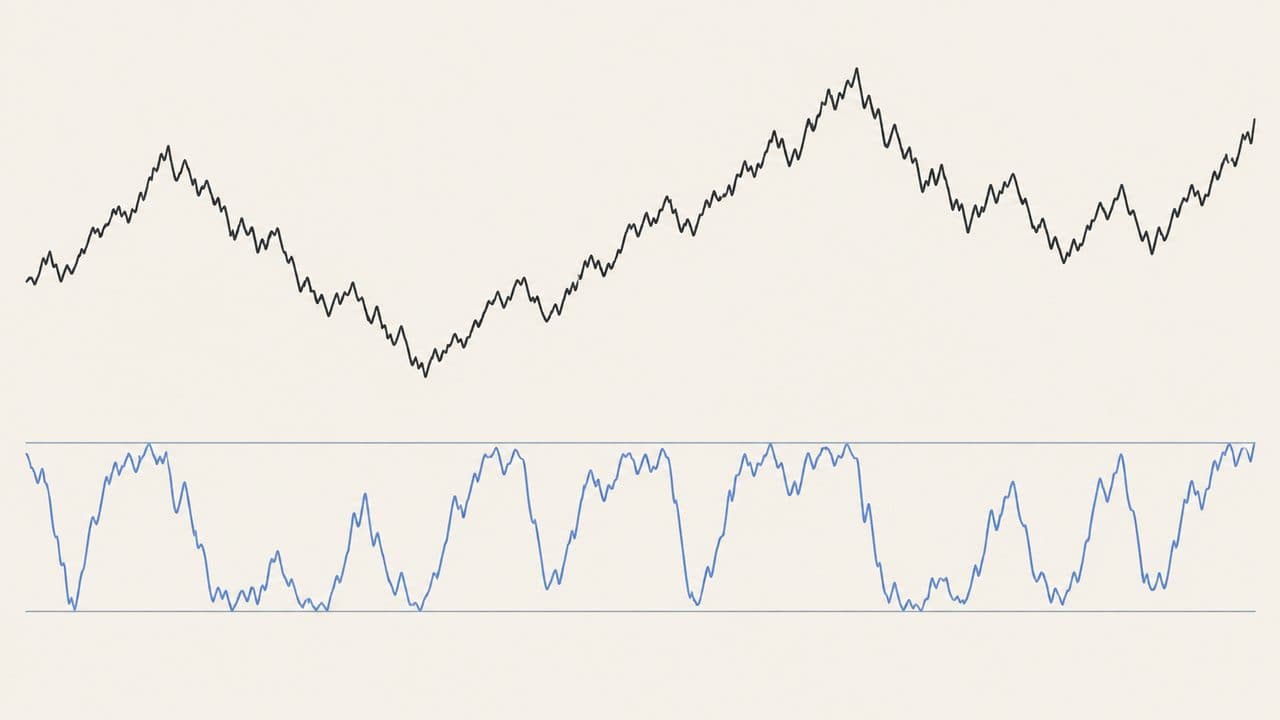
Williams %R answers the same question as the stochastic oscillator — where did the close land inside the last 14 bars' range? — and reports it upside down: 0 means the close is at the highest high, −100 means it is at the lowest low. It is the fast stochastic %K minus 100, nothing more. If you already understand the stochastic, you understand this.
It lies exactly where the stochastic lies. A market closing near its highs day after day is a market going up, and %R will sit between 0 and −20 for as long as that lasts. Reading "overbought" as "about to fall" is how the indicator loses people money.
What it measures
Larry Williams published the calculation in the 1970s for commodity traders. Fourteen periods is the convention; it is not an optimum. Shorter windows change the reference range constantly and swing between the extremes on ordinary noise; longer windows are slower and can hold a reading at one end for weeks.
The scale is bounded, which makes the indicator look more definite than it is. The boundaries describe the recent sample of highs and lows. They are not states of the market.
The formula, in words
%R = −100 × (highest high of n bars − close) ÷ (highest high of n bars − lowest low of n bars)
No smoothing. If the highest high equals the lowest low, the denominator is zero and the platform must decide what to show. Some platforms display 0 to −100, others flip the sign; the arithmetic is the same.
Worked example
Fourteen-bar high 110, low 90, close 106. Range 20. High minus close 4. 4 ÷ 20 = 0.20. × −100 = −20.
The close is a fifth of the range below the high. Compare the stochastic on the same numbers: %K = 100 × (106 − 90) ÷ 20 = 80. Eighty minus one hundred is minus twenty. Same fact, different sign.
How it is read
Above −20 is called overbought, below −80 oversold. In plain terms: the close is in the top fifth, or the bottom fifth, of its two-week range. A move back out of the zone is read as momentum turning; it is really the close leaving one end of a rolling range, which it can do because price moved or because an old extreme dropped out of the window. Divergence — a new price high without a new %R high — is a comparison of two series, not a reversal.
When it lies
Location is not direction. In a trend, closes stay near one end of the range and %R stays "extreme" while the trend continues; in a range, it swings between the zones and produces reversals that do not follow through. When an old high or low leaves the window, the reading jumps with no change in price. A gap plants the close at an extreme without any of the gradual pressure the label implies. And a 14 chosen because it produced pretty turning points on last year's chart is a fitted parameter, not a finding.
What it does not tell you
Why the market moved, how volatile it will be, how much traded, or whether the price is cheap. Whether the extreme holds once the window rolls forward.
What the evidence actually says
The same three papers apply to every indicator in this series, so the short version: Brock, Lakonishok and LeBaron (1992) found simple moving-average and trading-range rules carried information on ninety years of the Dow; Sullivan, Timmermann and White (1999) showed that once you count how many rules were tried, the best of them stops being significant — the data-snooping result; Park and Irwin (2007) reviewed ninety-five later studies and found roughly half positive, a quarter negative, and most of the positives shrinking after costs. The RSI guide has the longer version.
None of the standard studies tests Williams %R, and it would be surprising if they did: it is a linear transformation of the stochastic, so any evidence about one is evidence about the other, and the evidence about the stochastic is thin.
Where it fits
The stochastic 14/3 on our signal pages is the same measurement with smoothing, so %R adds no new vote. If your MT5 template shows both, you are looking at one indicator twice.
A note on risk: a reading of −5 is a close near the top of its range, which is what strong markets look like every day. Do not short strength because a bounded scale ran out of room.
Sources
- Williams, Larry R., How I Made One Million Dollars Last Year Trading Commodities (1979 ed.): Google Books
- Brock, Lakonishok and LeBaron (1992): DOI
- Sullivan, Timmermann and White (1999): DOI
- Lo, Mamaysky and Wang (2000): DOI
- Park and Irwin (2007): DOI
- Menkhoff and Taylor (2007): DOI
- Murphy, John J., Technical Analysis of the Financial Markets (1999): Google Books
Written by the Ultimo Research Desk and checked against our own contract specifications and client agreement before publication; reviewed again when those change. Educational only — nothing here is a recommendation to trade. Spotted an error? Tell us.