What each indicator measures — and when it lies.
20 technical indicators, one guide each. Every guide sets out what the indicator measures, the formula in plain words with a worked example, the conditions in which it is known to mislead, and what the peer-reviewed research says, with the papers linked. Indicators are calculated from past prices; the guides treat them as descriptions of what has happened rather than predictions of what will.
Guides marked live cover the indicators used in our hourly technical readings; each reading on those pages links to the guide that explains it.
Part one — the core indicators
The indicators used in our hourly technical readings, together with four others in common use.
01 · 8 minute readlive
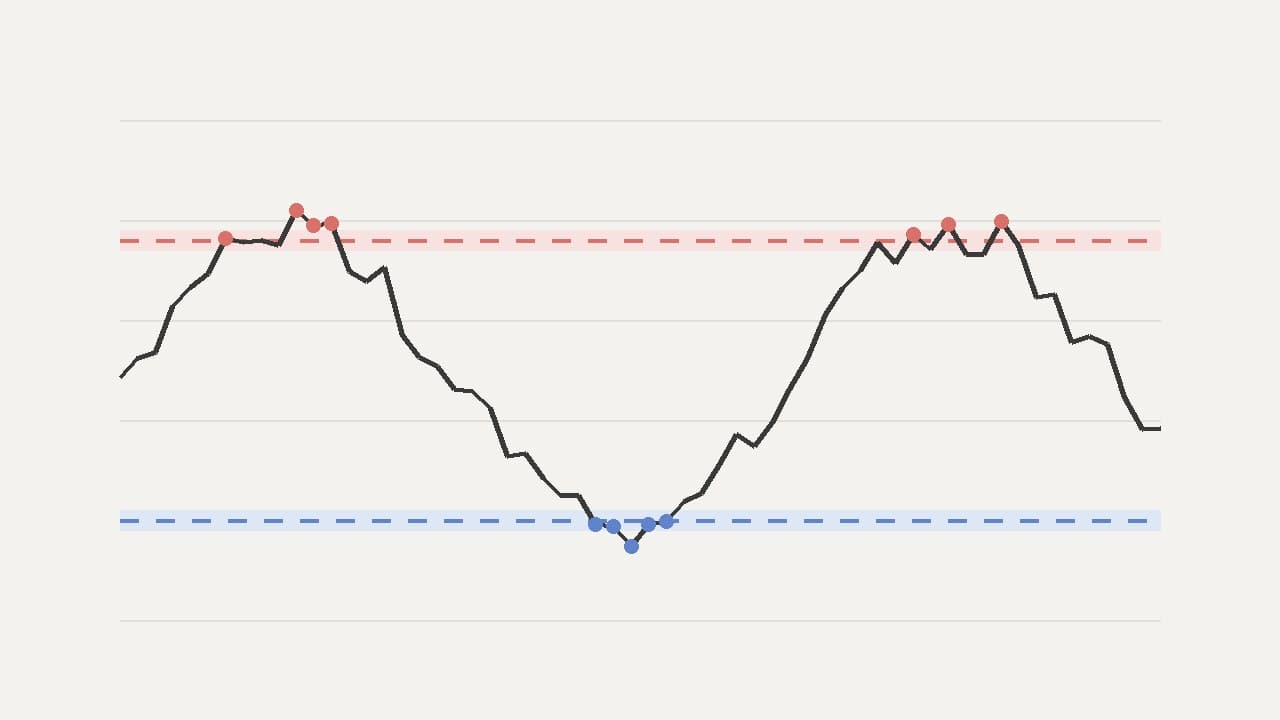
RSI: What It Measures and When It Lies
Recent gains measured against recent losses on a 0–100 scale. Least reliable in a strong trend.
02 · 8 minute readlive
MACD: What It Measures and When It Lies
The gap between two exponential averages, smoothed once more. Least reliable in a sideways market.
03 · 8 minute readlive
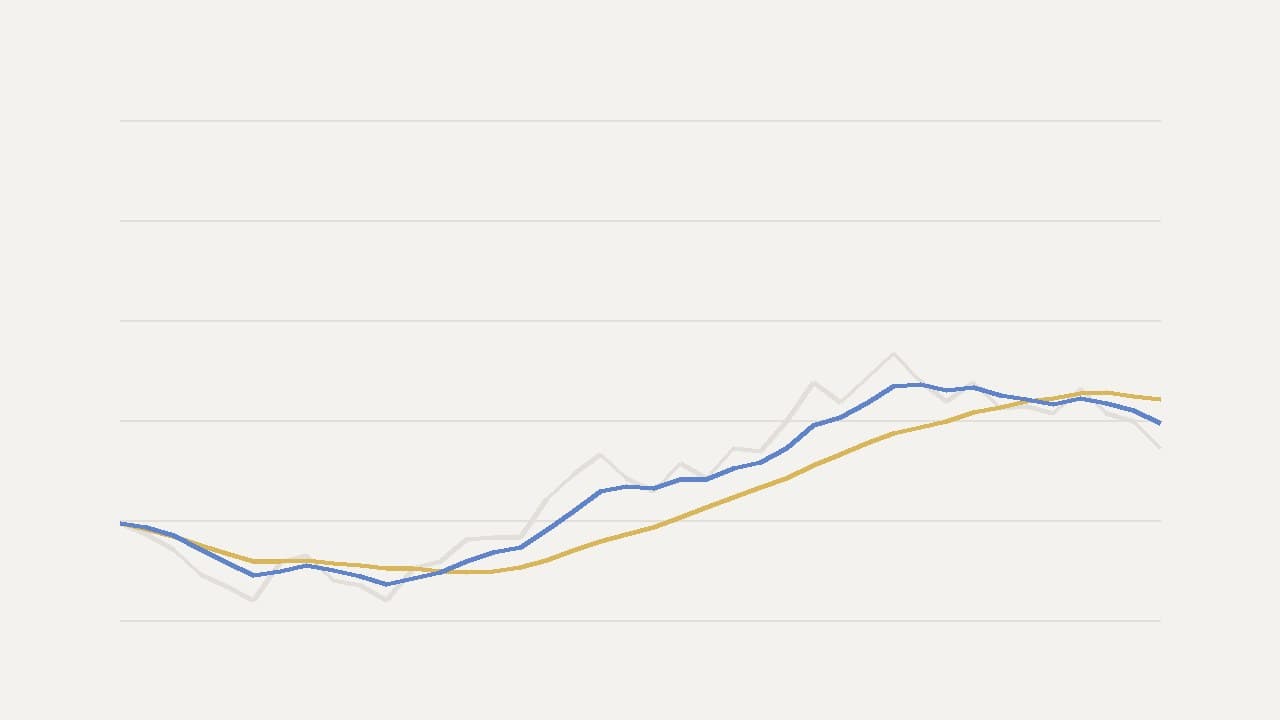
Simple vs Exponential Moving Averages: What They Measure and When They Lie
Equal weighting or recent-weighted; both lag price by construction.
04 · 8 minute read
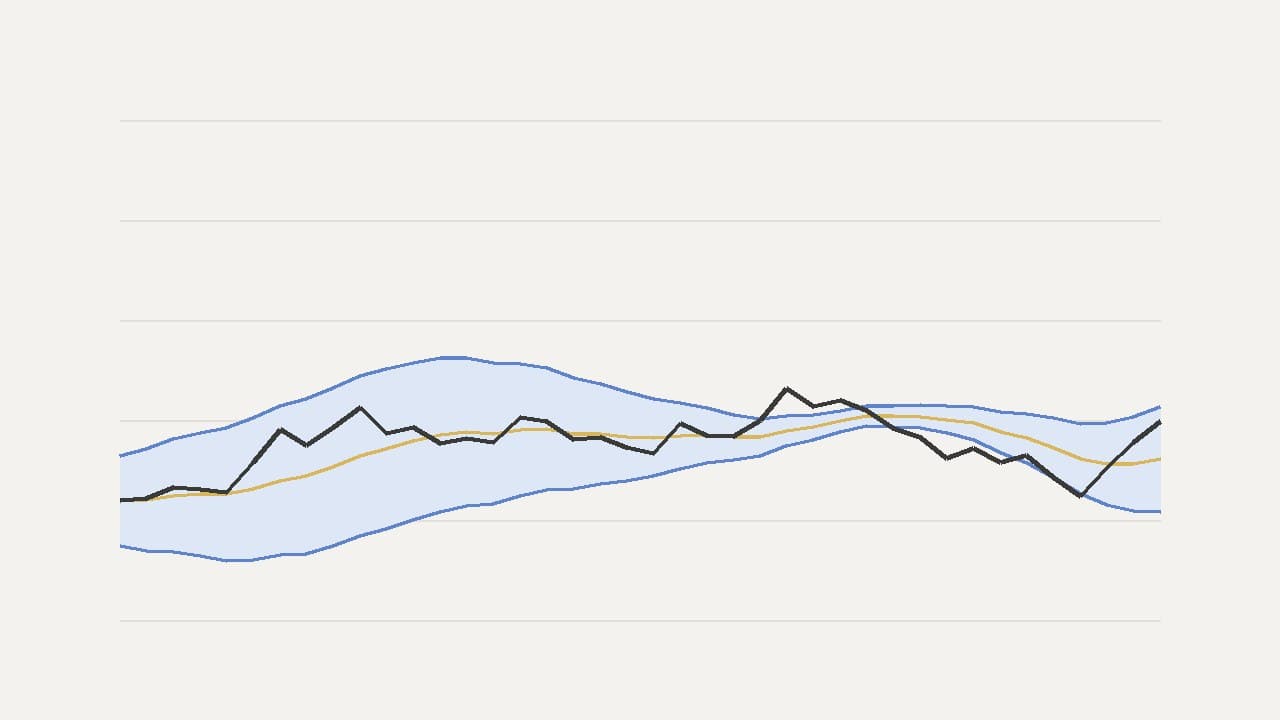
Bollinger Bands: What They Measure and When They Lie
A moving average with two standard deviations either side. A touch of a band indicates position, not direction.
05 · 7 minute readlive
Stochastic Oscillator: What It Measures and When It Lies
Where the close sits within its recent range. Remains at an extreme for as long as a trend persists.
06 · 8 minute read
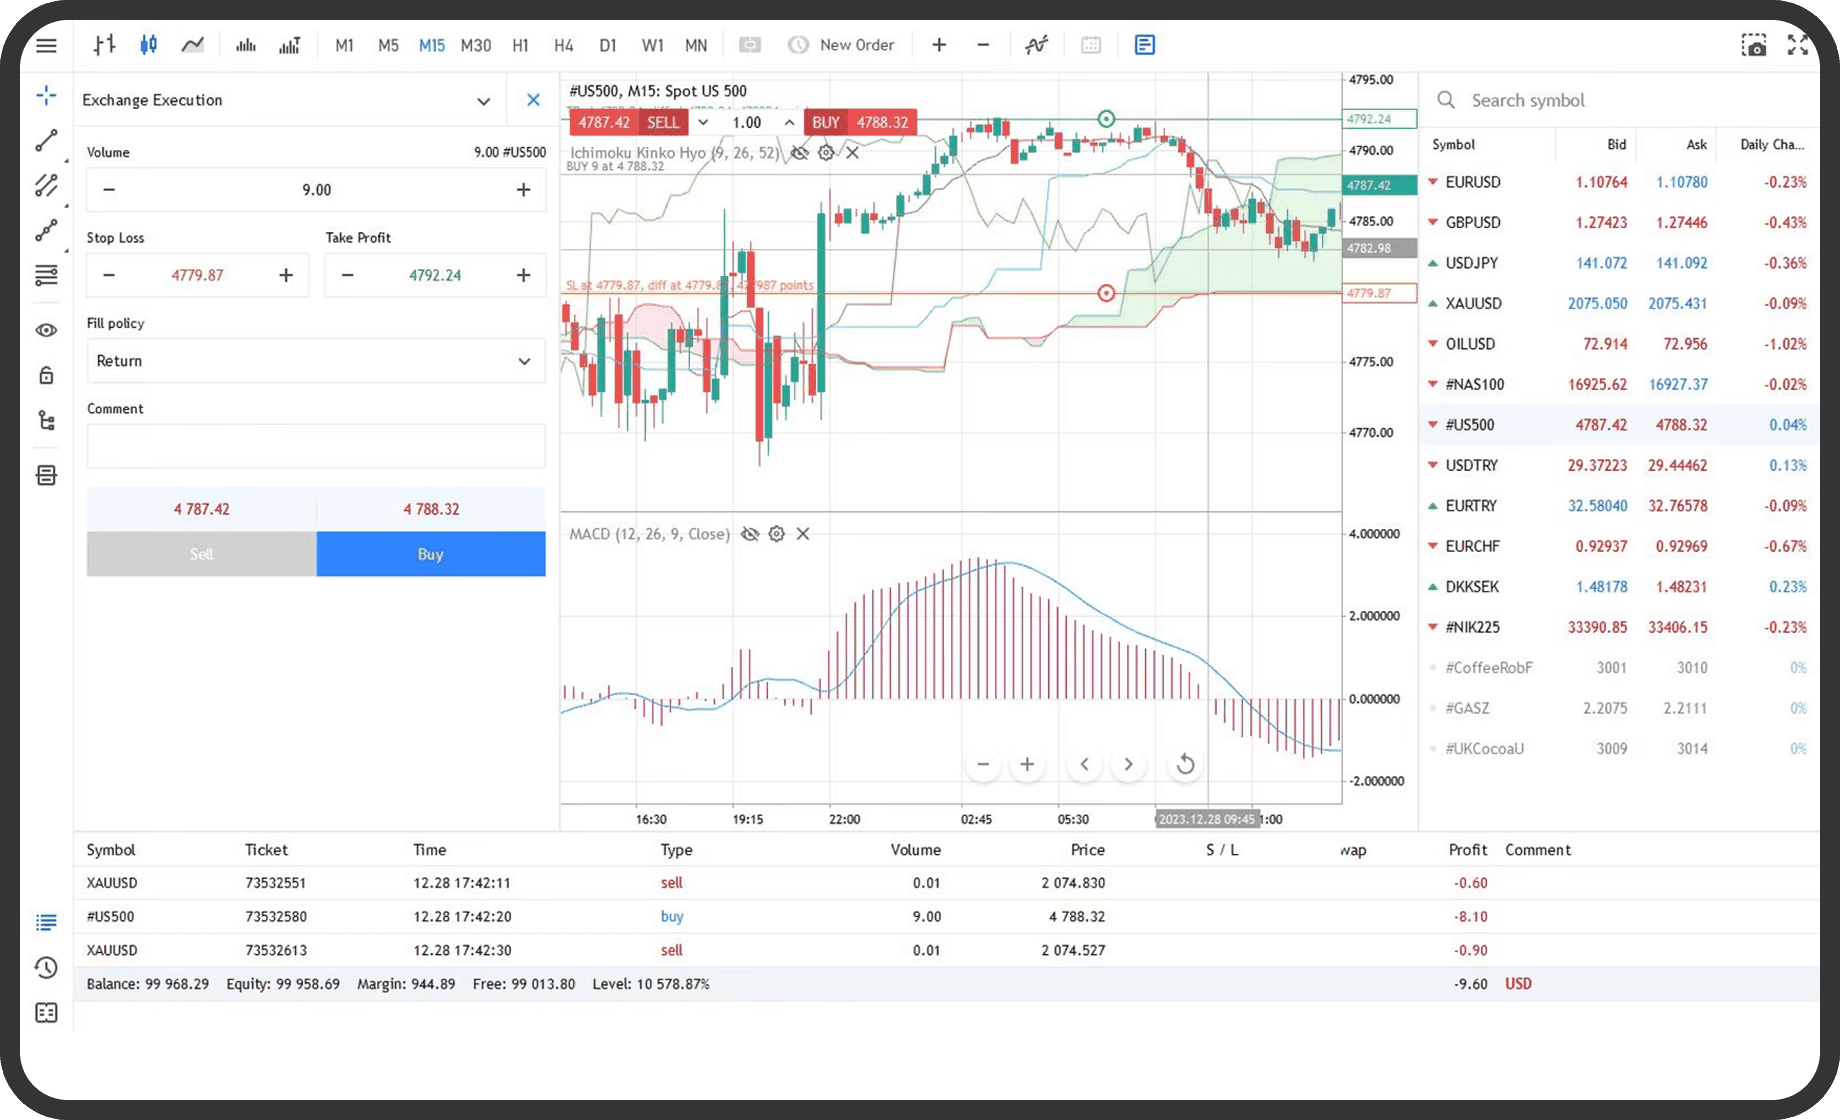
ATR and Volatility Stops: What They Measure and When They Lie
The size of a typical bar, gaps included. A measure for stop distances rather than a signal.

07 · 7 minute readlive
Pivot Points: What They Measure and When They Lie
Seven levels computed from the previous session’s high, low and close. Sensitive to how the session is defined.
08 · 8 minute read
Volume and On-Balance Volume: What They Measure and When They Lie
A measure of activity rather than direction — and on forex and CFD charts, a count of price updates rather than traded value.
09 · 9 minute read
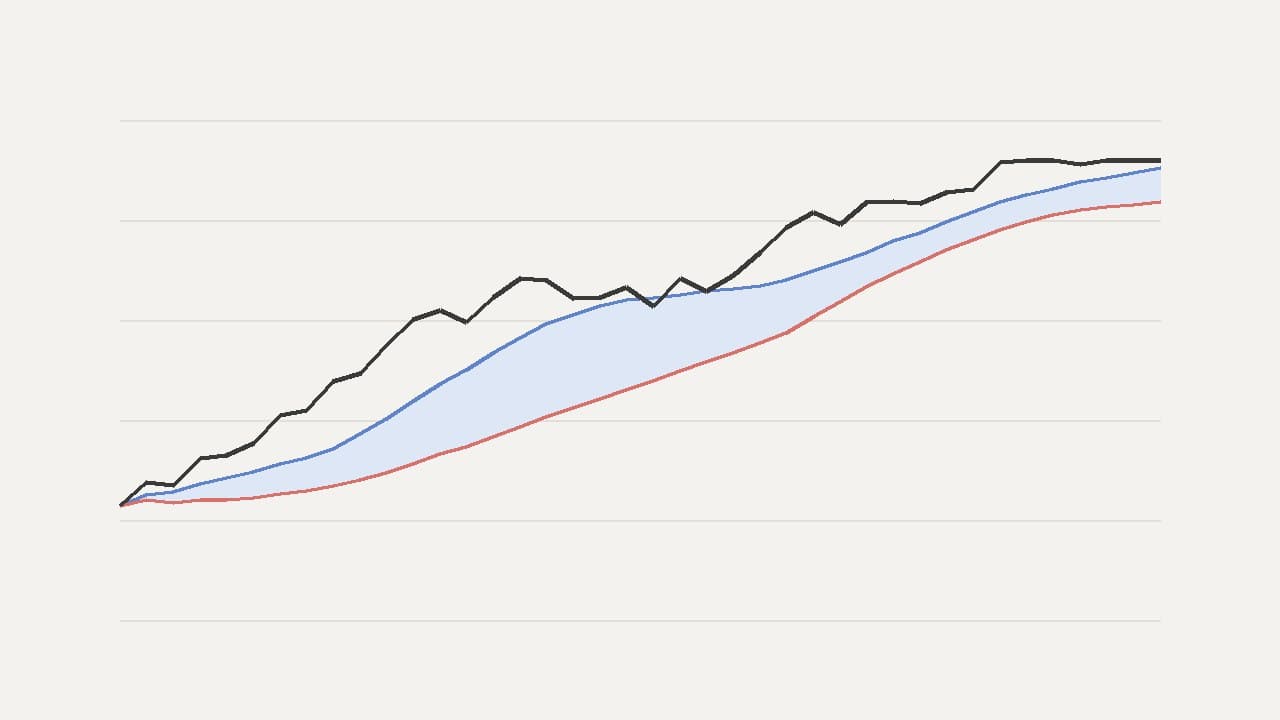
Ichimoku Cloud: What It Measures and When It Lies
Five range midpoints, two of them plotted 26 bars ahead. The forward cloud is a display offset, not a forecast.

10 · 8 minute read
Fibonacci Retracements: What They Measure and When They Lie
Fixed fractions of a chosen price swing. The result depends entirely on the swing selected.
Part two — trend filters, channels and volatility
Trend-strength measures, price channels, volume benchmarks and the volatility statistics that underlie several of the indicators in part one.
11 · 9 minute read
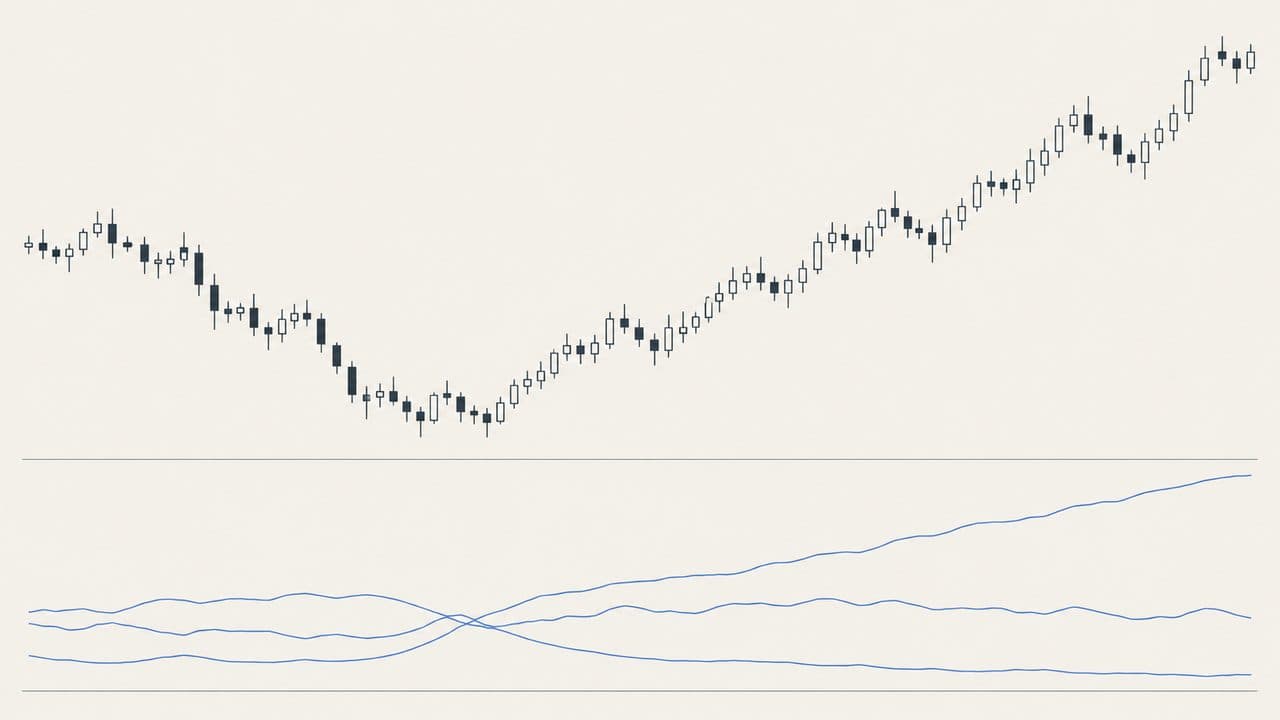
ADX and the Directional Movement Index: What They Measure and When They Lie
How one-directional recent movement has been, without saying which direction. Confirms a trend after it is under way.
12 · 8 minute read
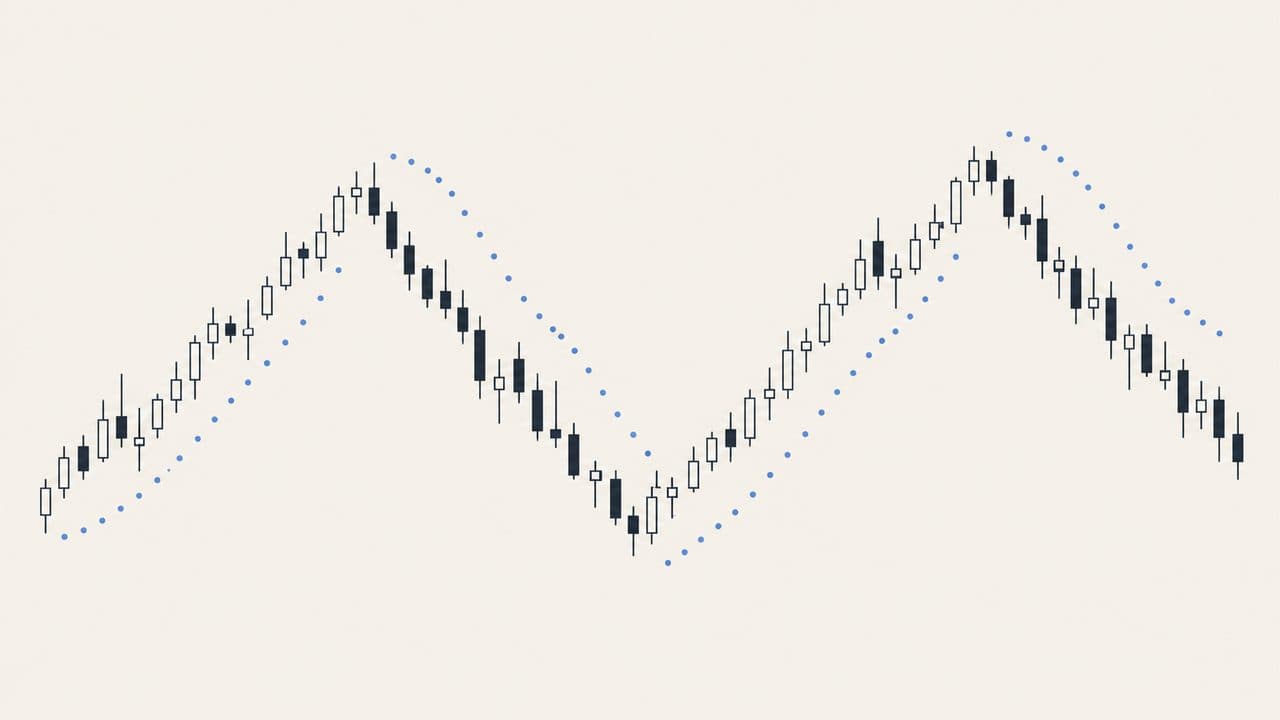
Parabolic SAR: What It Measures and When It Lies
A trailing level that accelerates with the trend and reverses when crossed. Prone to repeated reversals in a range.
13 · 7 minute read
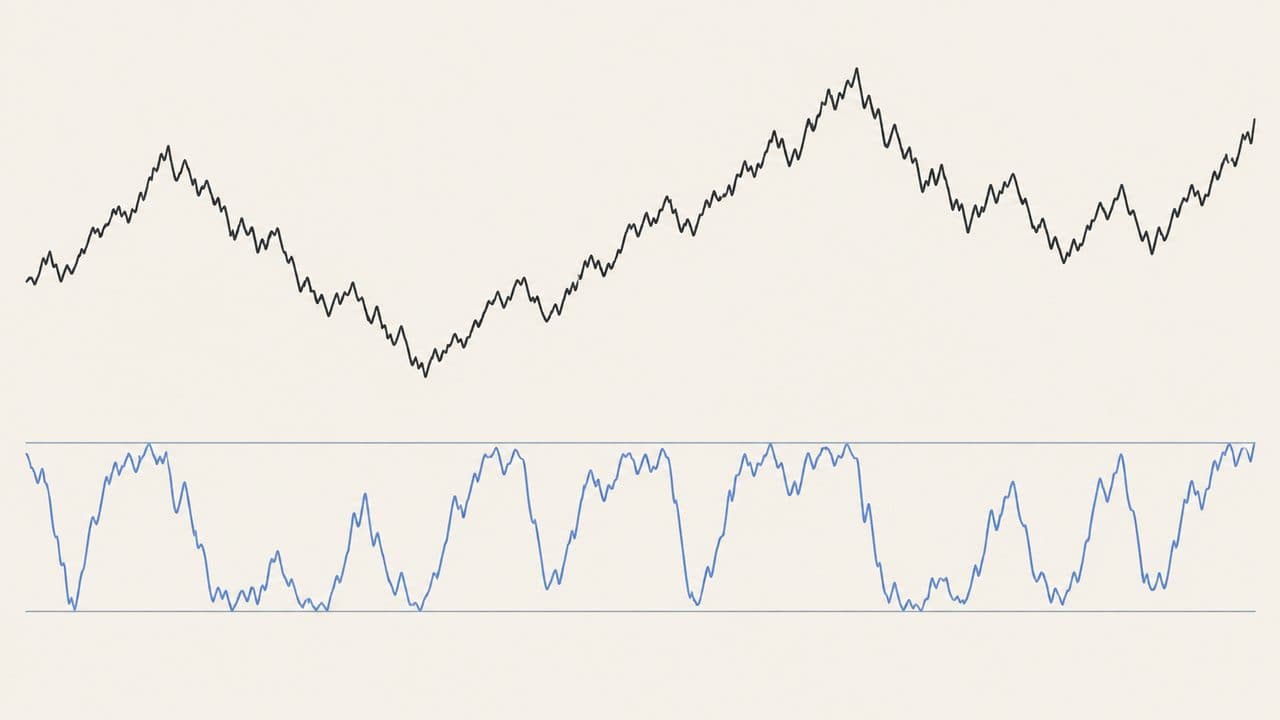
Williams %R: What It Measures and When It Lies
The stochastic oscillator on an inverted 0 to −100 scale; the same measurement with a different sign.
14 · 7 minute read
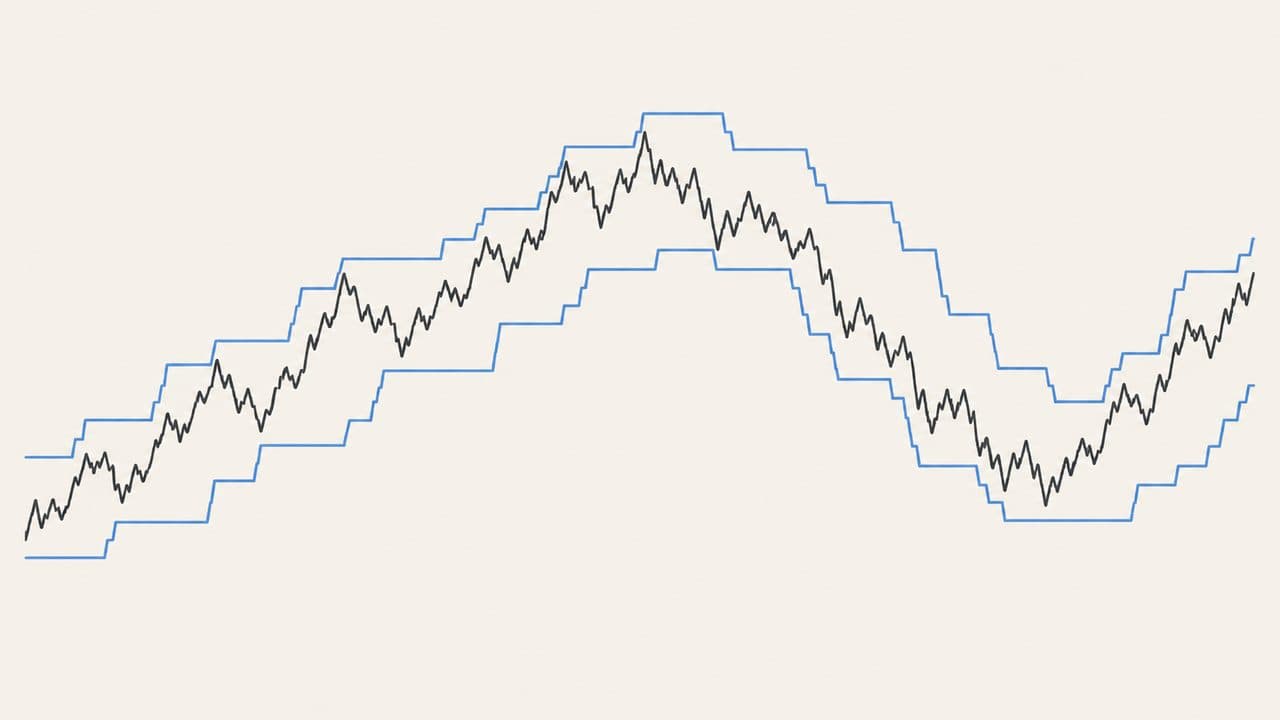
Commodity Channel Index: What It Measures and When It Lies
Distance from the 20-bar average, in units of typical deviation. The ±100 levels are conventions, not boundaries.
15 · 8 minute read
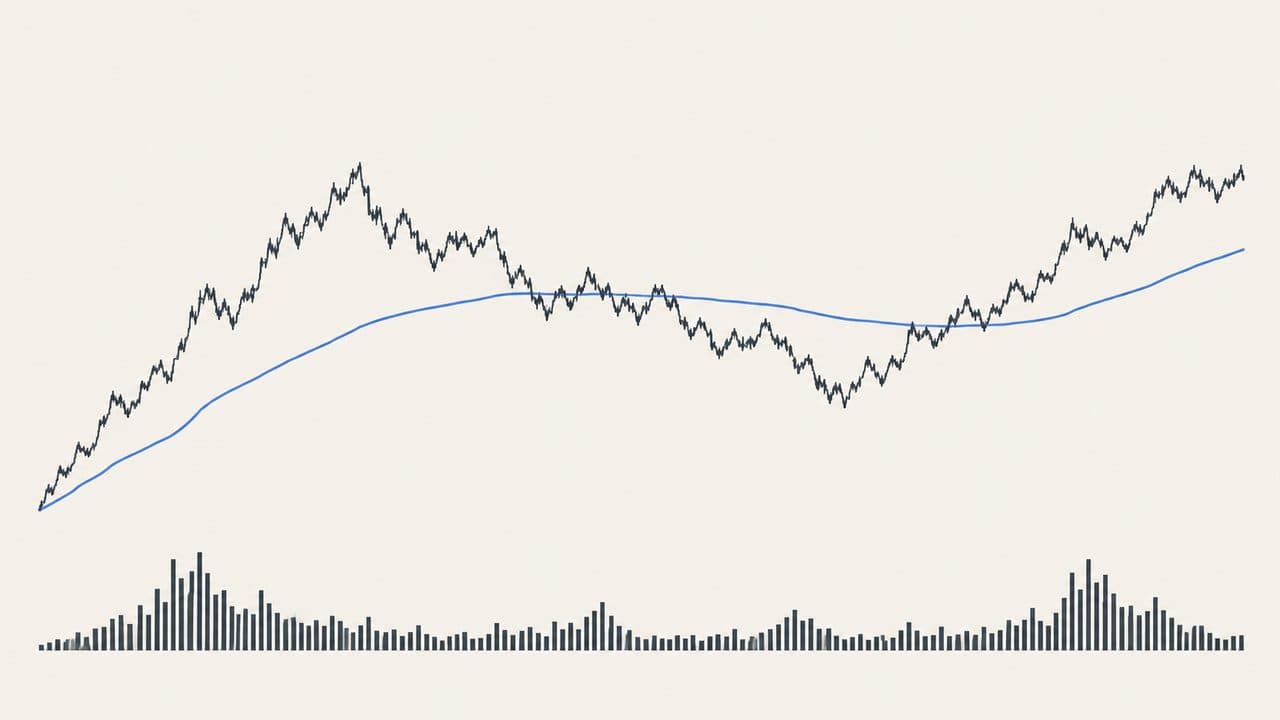
VWAP: What It Measures and When It Lies
The volume-weighted average price of the session. On forex and CFD charts it is built from tick counts, which limits its meaning.
16 · 7 minute read
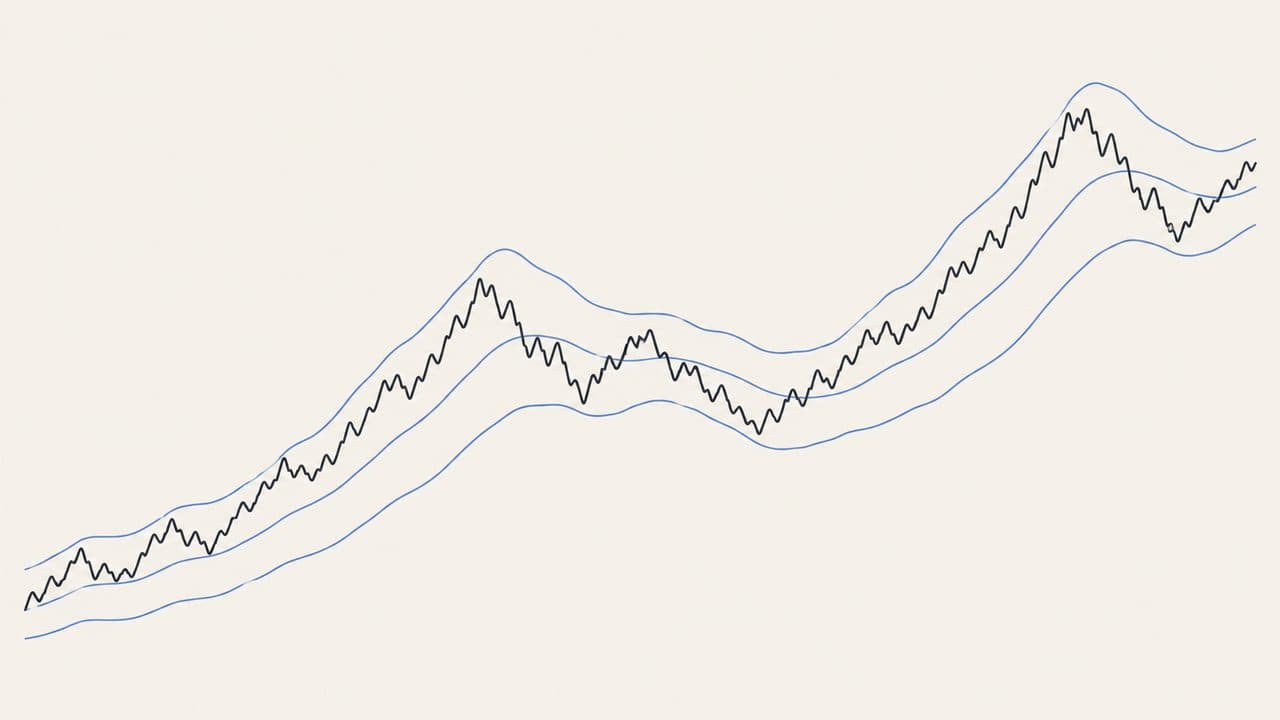
Keltner Channels: What They Measure and When They Lie
An exponential average with a multiple of ATR either side — a volatility envelope similar to Bollinger Bands but smoother.
17 · 7 minute read
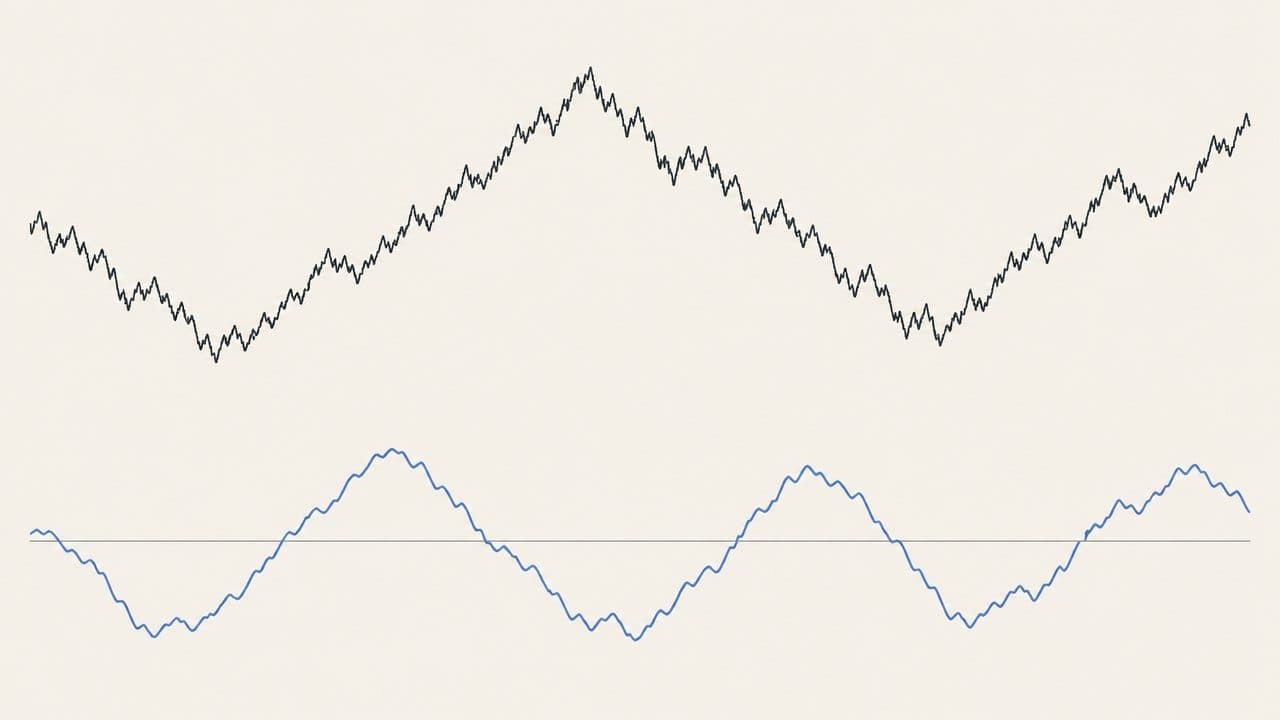
Donchian Channels: What They Measure and When They Lie
The highest high and lowest low of the last 20 bars. Widely followed by systematic trend-following strategies.
18 · 7 minute read
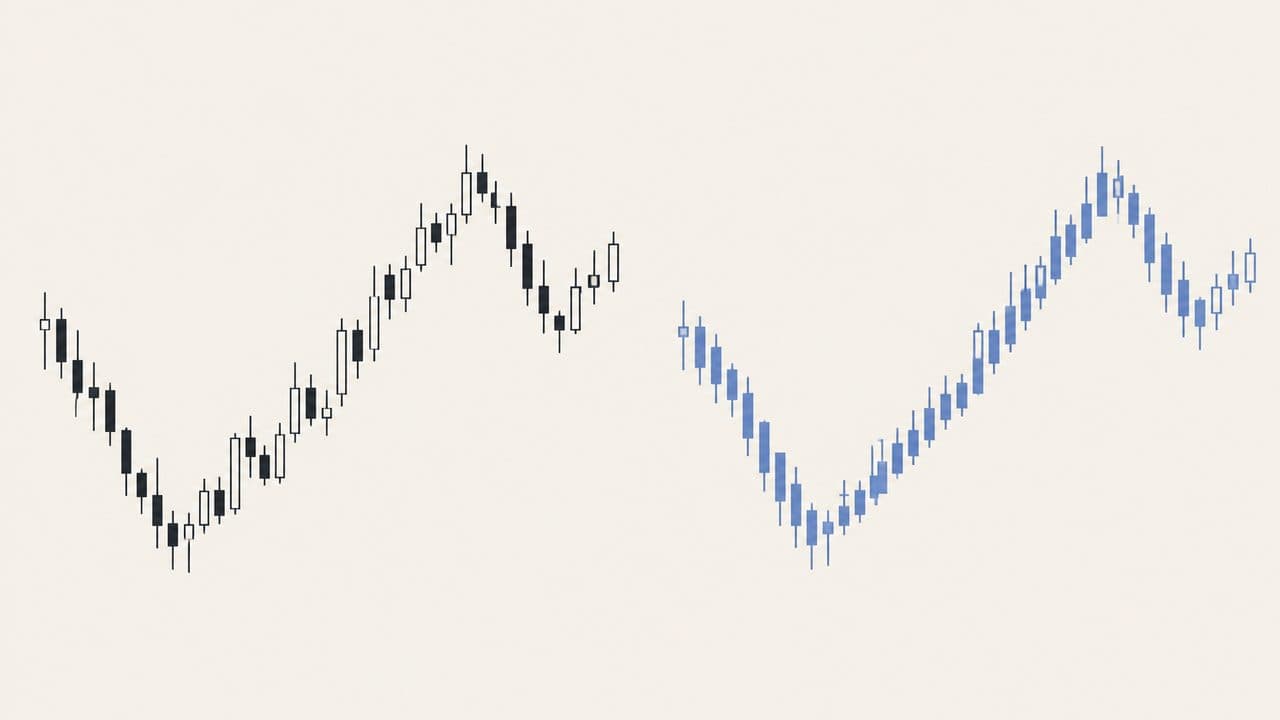
Heikin-Ashi Candles: What They Measure and When They Lie
Smoothed candles built from averages rather than traded prices. Not suitable for placing stops or targets.
19 · 8 minute read
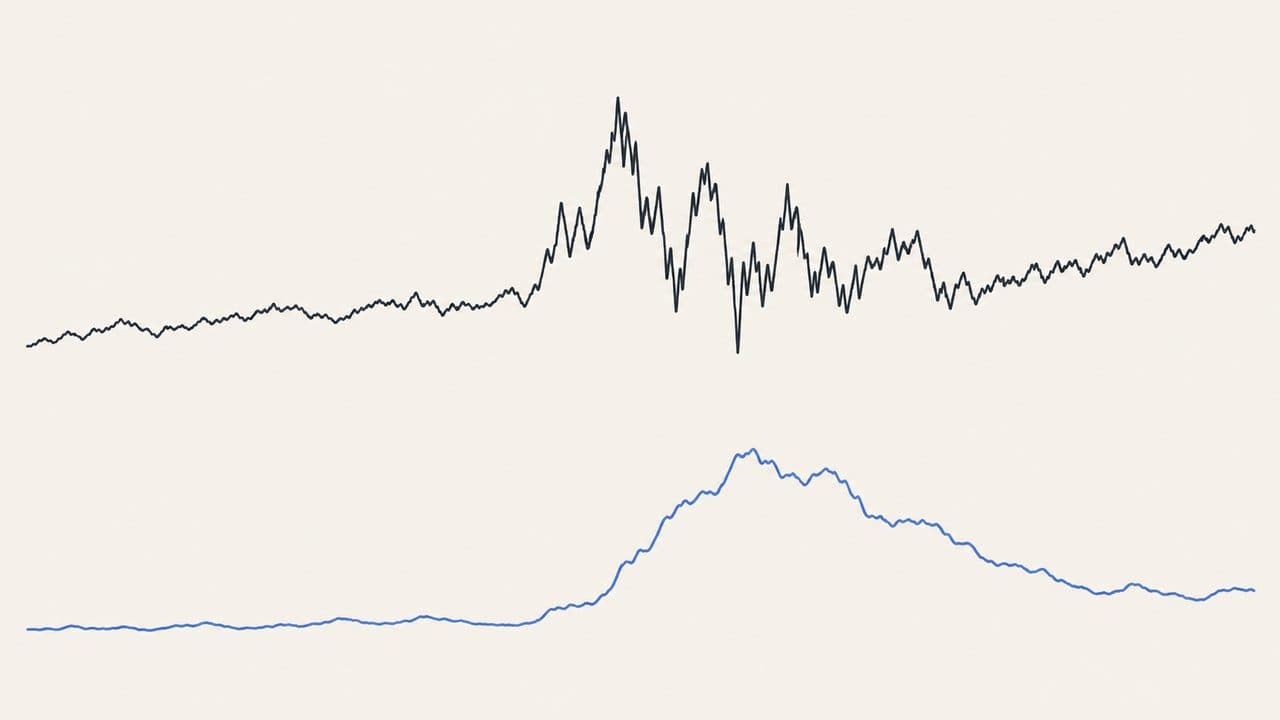
Standard Deviation and Historical Volatility: What They Measure and When They Lie
The dispersion of past returns, annualised by convention. A description of the recent sample, not a forecast.
20 · 7 minute read
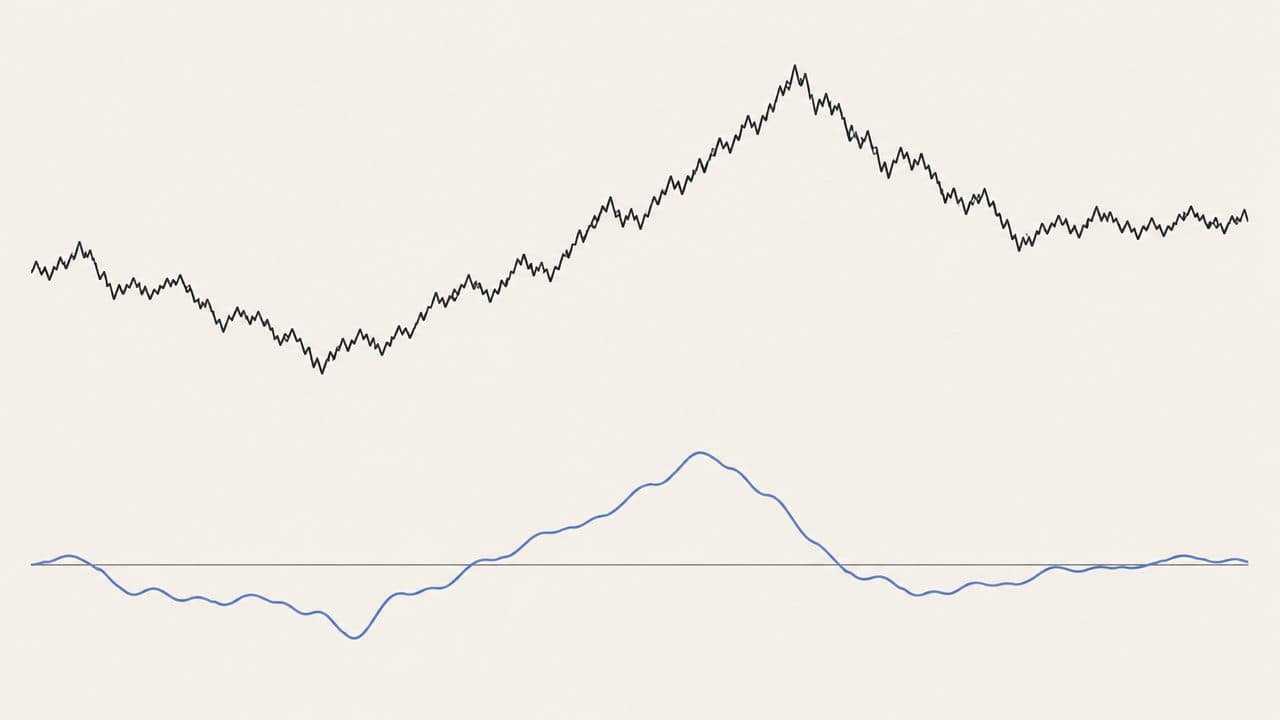
Rate of Change and Momentum: What They Measure and When They Lie
Today’s close compared with the close n bars ago. Sensitive to the bar leaving the window as well as the bar entering it.
See them on a live chart
The technical signals pages show RSI, MACD, three moving averages, the stochastic and the day’s pivot levels for each market, recalculated hourly, with each reading explained in a sentence.
Educational content. Indicators describe past prices and can be wrong; nothing here is investment advice or a recommendation to trade. Trading leveraged products involves significant risk of loss.